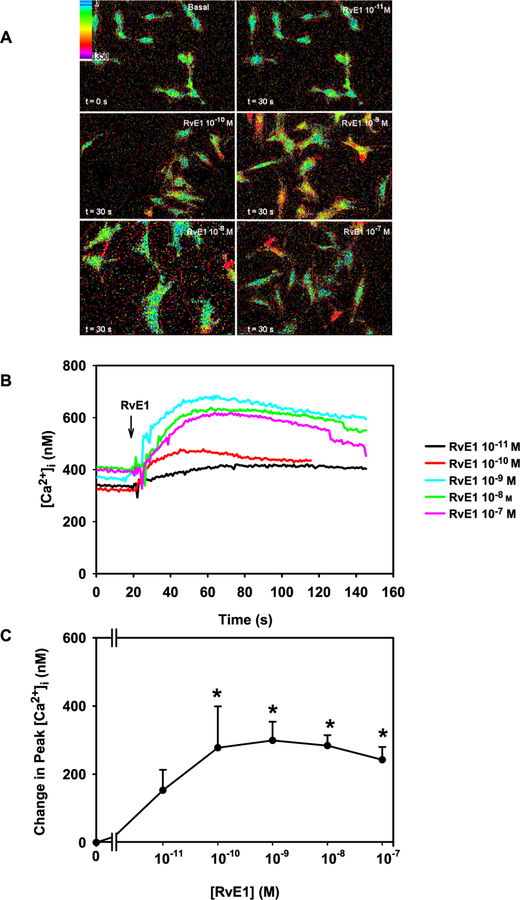
Fig. 2. RvE1 elevates [Ca2+]i in rat conjunctival goblet cells.
Cultured goblet cells were incubated with fura-2/AM and stimulated with increasing concentrations of RvE1 (10−11-10−7 M). Representative pseudo color pictures of [Ca2+]i in goblet cells stimulated by RvE1 are shown in A. [Ca2+]i over time in response to RvE1 (10−11–10−7 M) is shown in B. Change in peak [Ca2+]i was calculated in response to increasing concentrations of RvE1 is shown in C. Data in B and C are from 6 independent experiments. Data in C are mean ± SEM. * indicates significant difference from basal. (For interpretation of the references to color in this figure legend, the reader is referred to the Web version of this article.)

