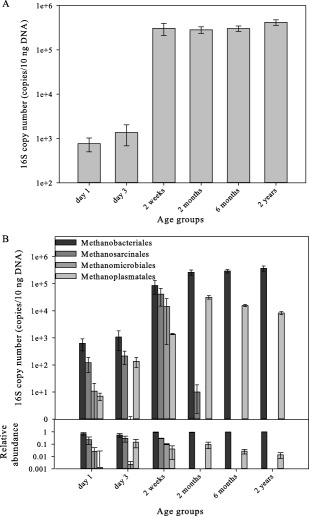
Figure 4.

Methanogenic community abundance and composition changes with age. Quantification of (A) total methanogenic communities and (B) the four major methanogenic orders: Methanobacteriales, Methanomicrobiales, Methanosarcinales and Methanoplasmatales by qRT‐PCR. Each timepoint represents the average of at least four animals. Mean for each timepoint is plotted ± SEM.
