
Figure 2. Two glycosylation steps to GA2 and its new analogs.
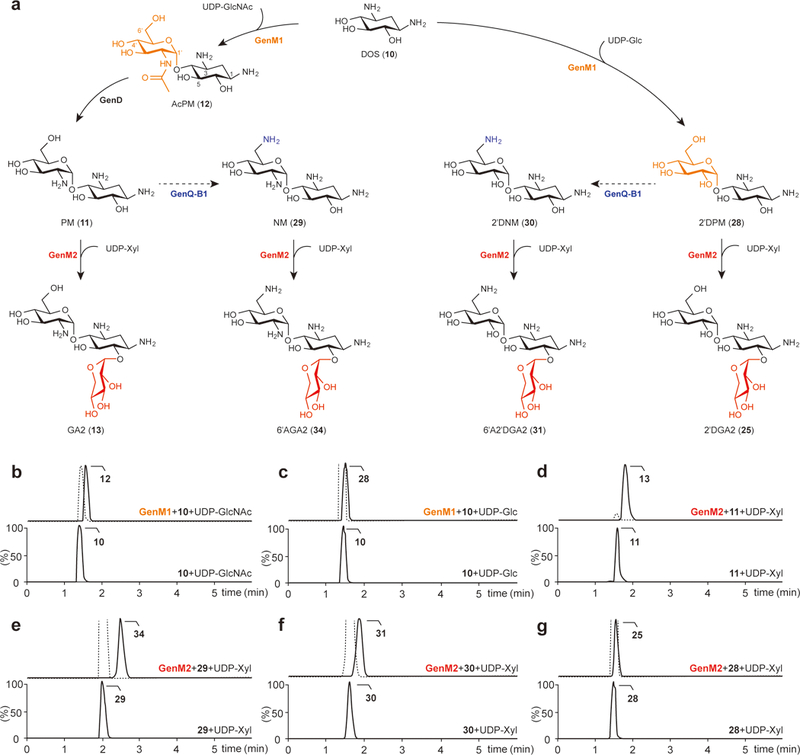
(a) Biosynthetic pathways to GA2, 6′AGA2, 6′A2′DGA2, and 2′DGA2 catalyzed by the glycosyltransferases GenM1 and GenM2. Each colored functional group represents those formed by the enzymes indicated by the same color. The predicted C6′-amination steps from PM and 2′DPM to NM and 2′DNM, respectively, are depicted by dashed lines. (b,c) Chromatograms of the GenM1-catalyzed production of AcPM (selected for m/z = 366.1871) from DOS (selected for m/z = 163.1077) and UDP-GlcNAc (b) and 2′DPM (selected for m/z = 325.1605) from DOS and UDP-Glc (c). (d–g) Chromatograms of the GenM2-catalyzed production of GA2 (selected for m/z = 456.2188) from PM (selected for m/z = 324.1765) and UDP-Xyl (d), 6′AGA2 (selected for m/z = 455.2348) from NM (selected for m/z = 323.1925) and UDP-Xyl (e), 6′A2′DGA2 (selected for m/z = 456.2188) from 2′DNM (selected for m/z = 324.1765) and UDP-Xyl (f), and 2′DGA2 (selected for m/z = 457.2028) from 2′DPM and UDP-Xyl (g). Lower chromatograms show the reactions without enzymes as controls. The dotted line in the upper chromatograms indicates the remaining substrate. Chromatograms show representative results of n>5 independent reactions.