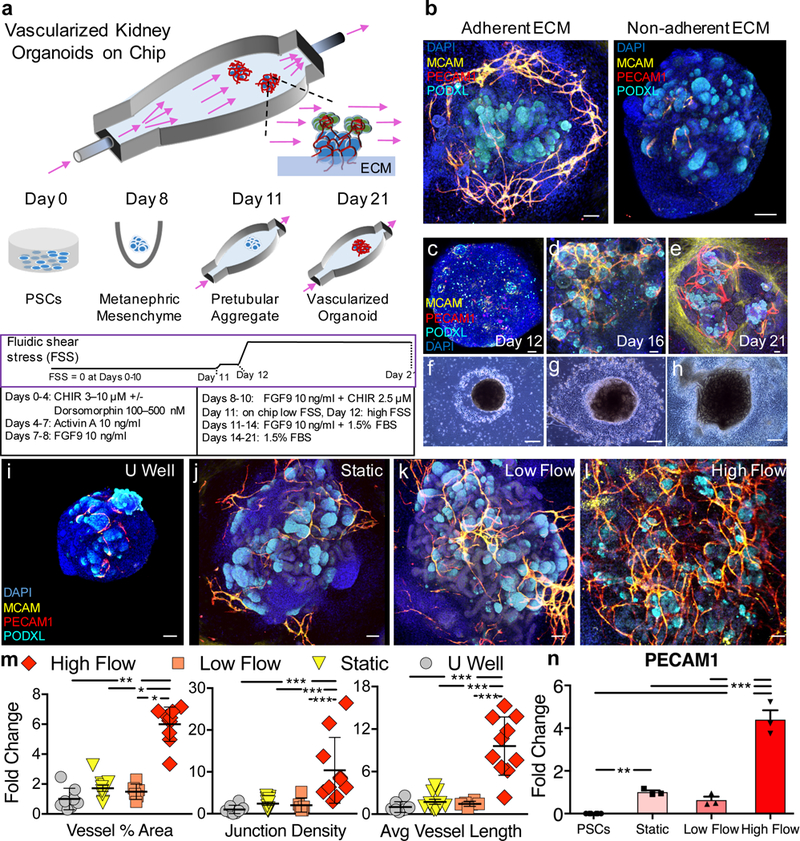
Figure 1. Developing kidney organoids cultured in vitro under high fluid flow exhibit enhanced vascularization during nephrogenesis.

(a) Developing renal organoids are placed on an engineered extracellular matrix (ECM), housed within a perfusable millifluidic chip, and subjected to controlled fluidic shear stress (FSS), note organoids not drawn to scale. (b) Enhanced peripheral vascular network formation in adherent compared to non-adherent underlying ECMs, scale bars = 100 μm. (c-e) Immunostaining of whole mount organoids and (f-g) representative phase contrast images of entire organoids cultured under high FSS (days 12–21), scale bars = 50 μm and 300 μm, respectively, where perfusion direction is left to right. (i-l) Confocal 3D renderings for vascular markers in whole-mount organoids cultured under static U-well, static on engineered ECM, low FSS, and high FSS, scale bars = 100 μm. (m) Angiotool output, which quantifies the abundance and character of vasculature, reported as a fold change relative to the U-well condition. For (m), biological replicates of 8, 11, 6, and 10 were used per condition (U well, Static, Low Flow, and High Flow, respectively) in experiments using both iPSC- and hESC-derived organoids where the entire organoid represents one replicate (one dot) and mean +/− std is plotted. (n) qPCR depicting increased PECAM1 expression under high FSS. The graph is plotted with mean +/− std. Dots on the bar chart represent three technical replicates on RNA pooled from 6 organoids (biological replicates) per condition. DAPI: 4’,6-diamidino-2-phenylindole, PECAM1: CD31, MCAM: CD146, KDR: FLK1, PODXL: podocalyxin, CDH1: E-cadherin, CHIR: CHIR99021, FGF9: fibroblast growth factor 9, FBS: fetal bovine serum. Statistical analysis for (m) and (n) is performed using GraphPad Prism 7 and statistical significance is determined at a value of p < 0.05 as determined by a 1way and 2way ANOVA, respectively, using Tukey’s multiple comparisons test. Different significance levels (p values) are indicated with asterisks as such: *p<0.05, **p<0.01, ***p<0.001.
