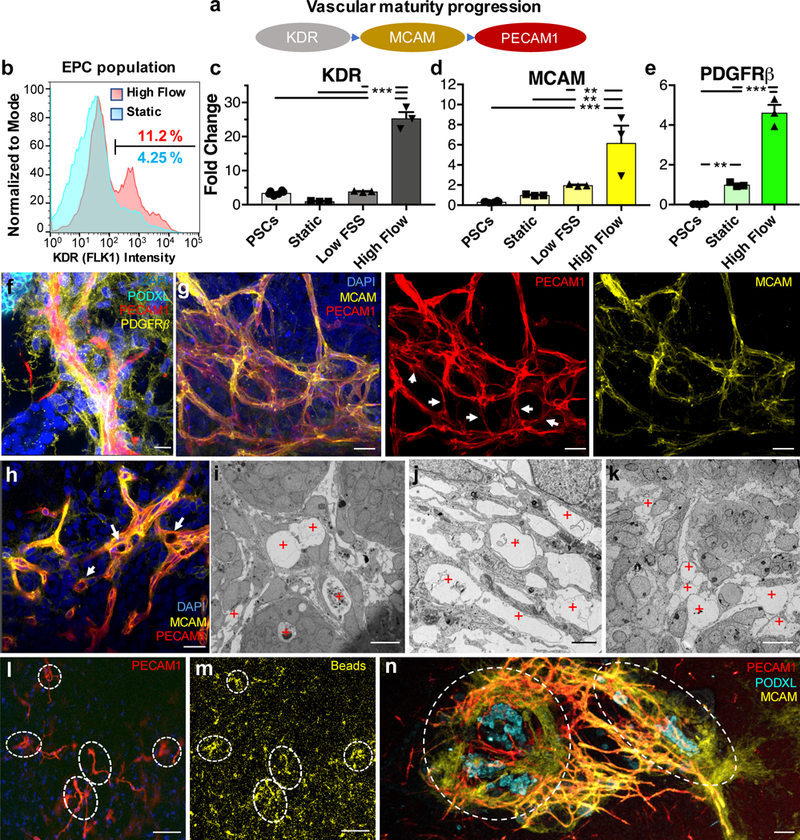
Figure 2. Intra and inter-organoid vascular networks with perfusable lumens supported by mural cells are observed for kidney organoids cultured under high flow in vitro.

(a) Diagram of endothelial maturation in developing kidneys in vivo, from progenitor cells to sustained terminal marker expression. (b) Flow cytometry of dissociated whole organoids depicting ~3-fold expansion of the endothelial progenitor cell (EPC) population in response to high FSS, compared to static conditions on chip. (c,d) qPCR of endothelial cell markers in developing organoids showing their upregulation following high FSS (day 21). (e) A key stromal marker is upregulated under high FSS, possibly due to mural cells associating with enhanced vasculature as shown in (f), scale bar = 15 μm. (g) Confocal 3D renderings of vascular markers within whole-mount organoids reveal that some features are best visualized in co-stained samples (left), as opposed to only mature (middle) and intermediate (right) markers, scale bars = 30 μm. White arrows highlight areas that are PECAM1+MCAM-, showing the two markers are not always co-expressed. (h) A single z-slice from (g) in which white arrows highlight open lumens, scale bar = 30 μm. (i-k) TEM images showing circular openings encompassed by a thin membrane that reflect vascular lumens for (i,j) kidney organoids subjected to high FSS and (k) E14.5 mouse embryonic kidney in vivo [Note: Hierarchial luminal diameters vary from 2 to near 20 μm (red plus signs reflect vascular lumens), scale bars = 10 μm for (i,k) and 2 μm for (j)]. (l,m) Z-slice at the base of a kidney organoid cultured under high FSS, showing in (l) the vascular network and in (m) the accumulation of fluorescent beads within the vascular network, scale bars = 100 μm. (n) Confocal 3D rendering of bridging between two adjacent, whole organoids (outlined by dashed white lines, scale bar = 100 μm. DAPI: 4’,6-diamidino-2-phenylindole, PECAM1: CD31, MCAM: CD146, KDR: FLK1, PODXL: podocalyxin, PDGFRβ: platelet derived growth factor receptor beta. Dots on the bar charts (c-e) represent three technical replicates on RNA pooled from 6 organoids (biological replicates) per condition. All graphs are plotted with mean +/− std. Statistical analysis for (c-e) is performed using GraphPad Prism 7 and statistical significance is determined at a value of p < 0.05 as determined by a 1way ANOVA, using Tukey’s multiple comparisons test. Different significance levels (p values) are indicated with asterisks as such: *p<0.05, **p<0.01, ***p<0.001.
