
Figure 3. Tubular epithelia mature and undergo morphogenesis to become a polarized, ciliated compartment in contact with vasculature in response to the high flow condition on chip.
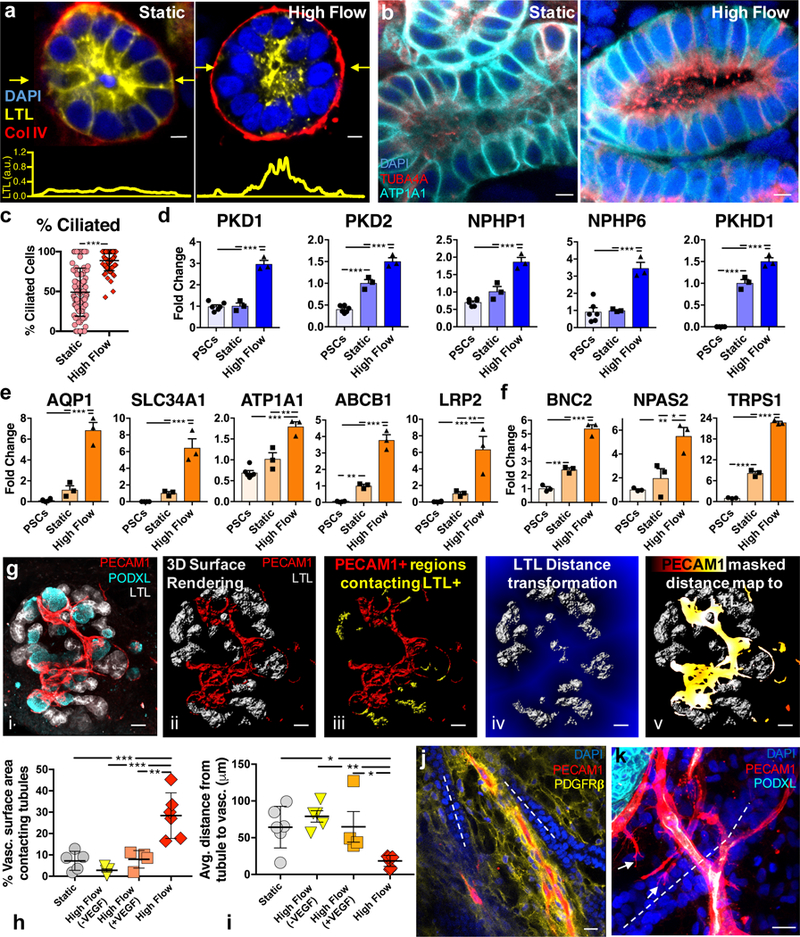
(a) Tubule cross-sections under static and high flow conditions showing proper basal expression of collagen IV in both cases, and proper apical expression of LTL under high flow at day 21, scale bars = 5 μm, the plots in yellow below show the intensity of LTL across a line scan denoted by yellow arrows in the images above. (b) Tubule cross-sections showing apical presence of cilia with higher prevalence (c) under high flow versus static conditions on chip and proper basolateral expression of ATP1A1 (Na/K ATPase) on day 21, scale bars = 5 μm. For (c), the static sample number is 101, and high flow is 64; samples are determined as a field of view in a LTL+ tubule where at least 8 cells could be viewed in cross section with cilia. (d-f) qPCR of ciliary markers, solute transporters, drug transporters, and adult transcription factors showing upregulation under high flow on day 21, compared to static conditions on chip and undifferentiated hPSCs. Whole organoid 3D confocal imaging stacks (gi, all scale bars = 50 μm) of a representative high flow sample are used to demonstrate the analysis method for the association of tubules with vasculature in Imaris 3D surface rendering (gii and giii) and distance transformation software (giv and gv) to find in (h) that the percent of vasculature surface area overlapping with LTL+ tubules within one voxel is significantly increased under high flow than in static conditions. Further, that tight vasculotubular association can be negated by dosing high amounts of VEGF or inhibiting VEGF in the media (h). Similarly, the average distance in 3D between the vasculature and the tubules decreases in the high flow condition (i) which does not significantly differ between static, high flow + VEGF, and high flow - VEGF (VEGF inhibition) conditions. Note the data in (h,i) represents biological replicates, or whole organoids, of 6, 5, 4, and 6 per condition (Static, High Flow (-VEGF), High Flow (+VEGF), and High Flow, respectively). (j,k) Immunostaining showing that PECAM1+ networks associate with tubular structures in both traverse and longitudinal planes in high flow at day 21, scale bars = 20 μm. DAPI: 4’,6-diamidino-2-phenylindole, LTL: lotus tetragonolobus lectin, PECAM1: CD31, PODXL: podocalyxin, TUBA4A: tubulin alpha 4a (also known as acetylated tubulin), AQP1: aquaporin 1, SLC34A1: Na/Phos cotransporter, ATP1A1: Na/K ATPase, ABCB1: MDR1, LRP2: Megalin, BNC2: basonuclin 2, NPAS2: neuronal PAS domain protein 2, TRPS1: transcription repressor GATA binding 1, PKD1: polycystin 1, PKD2: polycystin 2, NPHP1: nephrocystin 1, NPHP6: nephrocystin 6, PKHD1: fibrocystin. All statistical analysis is performed using GraphPad Prism 7 software. All graphs are plotted with mean +/− std. For (c) statistical significance is determined at a value of p < 0.05 as determined by an unpaired t test with Welch’s correction. Dots on the bar charts (d-f) represent three technical replicates on RNA pooled from 6 organoids (biological replicates) per condition. Statistical analysis for (d-f, h,i) is determined at a value of p < 0.05 as determined by a 1way ANOVA, using Tukey’s multiple comparisons test. Different significance levels (p values) are indicated with asterisks as such: *p<0.05, **p<0.01, ***p<0.001.