
Figure 4. Flow-enhanced glomerular vascularization and morphogenesis of kidney organoids in vitro mirrors stages of glomerular development in vivo.
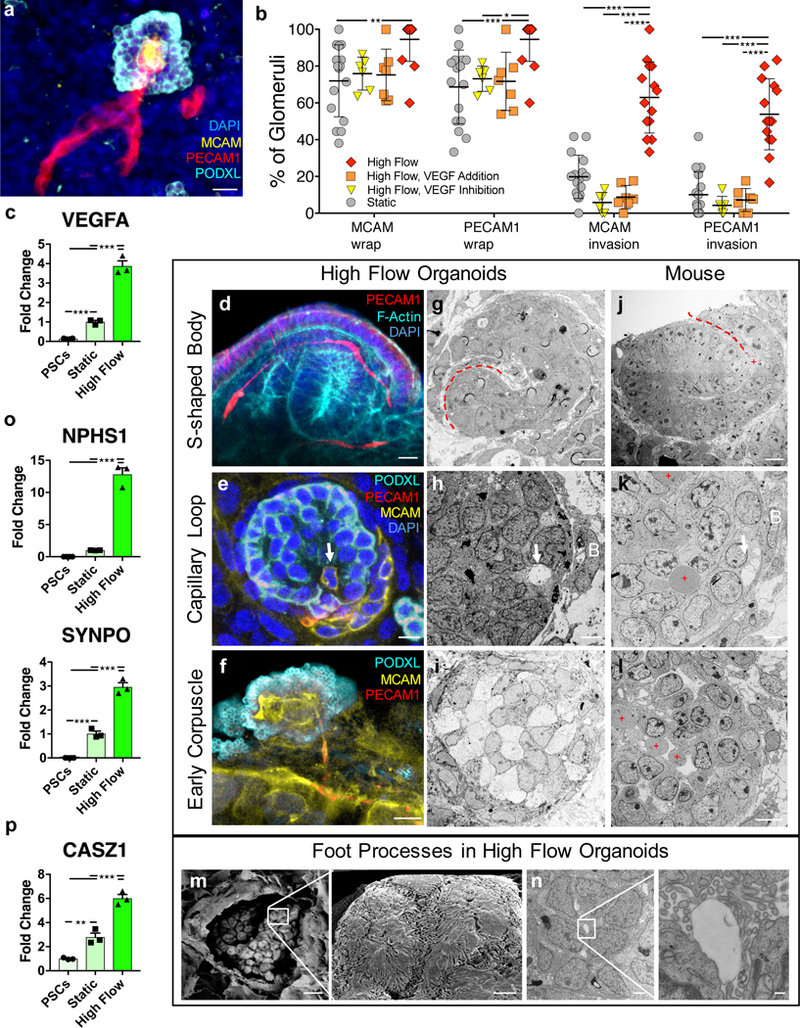
(a) A 3D rendered confocal image of vascular invasion in a PODXL+ cluster showing afferent and efferent vessels, scale bar = 40 μm. (b) Percent of PODXL+ clusters that exhibit vascular wrapping or invasion under static and high FSS ± VEGF (addition or inhibition) representing whole organoids of sample size 16, 6, 7, 14 for the conditions Static, High Flow VEGF Addition, High Flow VEGF Inhibition, and High Flow, respectively. (c) qPCR of VEGF showing significant upregulation in organoids cultured under high FSS in vitro (day 21). (d) A 3D rendered confocal image of capillary invasion in an S-shaped body in a vascularized organoid under high FSS in vitro (day 21), scale bar = 10 μm. (e) Single confocal z-slice showing capillary invasion with PECAM1+MCAM+ cell (white arrow) and MCAM+ vascular precursors (CD146+ cells), scale bar = 10 μm. (f) MCAM+PECAM1+ glomerular tuft-like formation shown as a single z-slice from confocal, scale bar = 10 μm. (g-i) TEM images of structures correlating with the IF images in kidney organoids (day 21), scale bars for (g,h) = 4 μm and (i) = 10 μm. Corresponding stages (j-l) in E14.5 mouse kidneys, where red dashed lines depict clefts, white arrows denote capillary invasion, B = Bowman’s capsule-like structure, and red plus signs denote RBCs, scale bars for (j,k) = 8 μm and (l) = 50 μm. (m) TEM images of a glomerular-like structure in organoids cultured under high FSS (day 21) showing a parietal membrane enclosing a visceral cluster of cells (left), which manifest interdigitating cytoplasmic projections extending across and into the plane of field on higher magnification (right), scale bars = 10 μm (left) and 1 μm (right). (n) TEM images of a glomerulus-like compartment in organoids cultured under high FSS (day 21) (left) in which higher magnification shows podocyte foot process abutting a glomerular tuft-like formation (right), scale bars = 2 μm (left) and 200 nm (left). (o,p) qPCR depicting significantly upregulated transcripts for podocyte foot process proteins (o) and an adult transcription factor (p). SSB: S-shaped body, CLS: capillary loop stage, DAPI: 4’,6-diamidino-2-phenylindole, MCAM: CD146, PECAM1: CD31, PODXL: podocalyxin, SYNPO: synaptopodin, NPHS1: nephrin, PDGFRβ: platelet derived growth factor receptor beta, VEGFA: vascular endothelial growth factor A, CASZ1: castor zinc finger 1. All statistical analysis is performed using GraphPad Prism 7 software. All graphs are plotted with mean +/− std. For (b) statistical significance is determined at a value of p < 0.05 as determined by a 2way ANOVA, using Tukey’s multiple comparisons test. Dots on the PCR plots in (c,o,p) represent three technical replicates on RNA pooled from 6 organoids (biological replicates) per condition. Statistical analysis for (c.o.p) is determined at a value of p < 0.05 as determined by a 1way ANOVA, using Tukey’s multiple comparisons test. Different significance levels (p values) are indicated with asterisks as such: *p<0.05, **p<0.01, ***p<0.001.