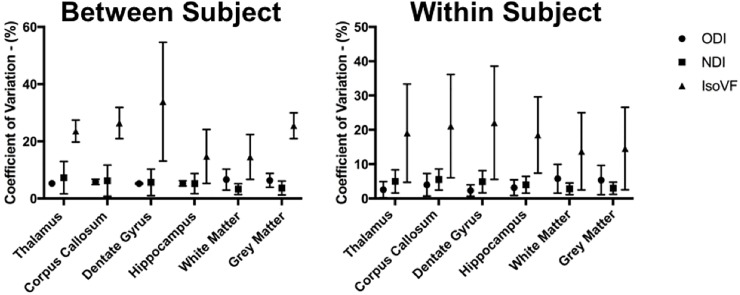
Fig 3. Mean coefficient of variation (CV) for each ROI.
Values for the between subject condition represent the mean ± standard deviation within each ROI averaged over a scan-rescan protocol. Values for the within subject condition represent the mean ± standard deviation within each ROI averaged over the eight subjects.

