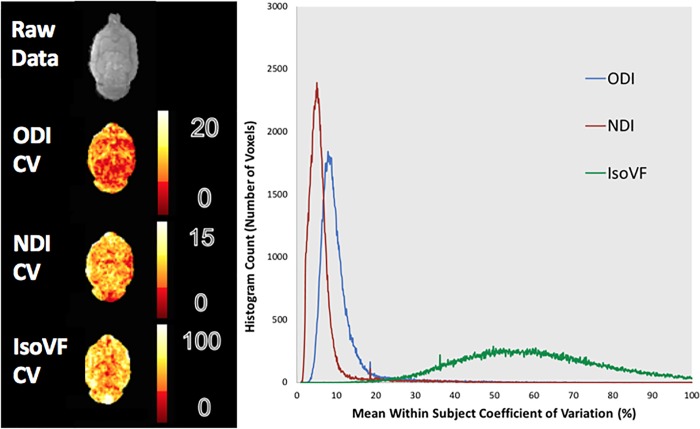
Fig 5. Whole brain average within subject CV maps and histogram.
Values for the within subject condition represent the mean CV within each voxel for each subject averaged over all eight subjects. The resulting histogram has been extracted from the averaged scans. Heat maps from a representative slice show the regional variation for each metric.

