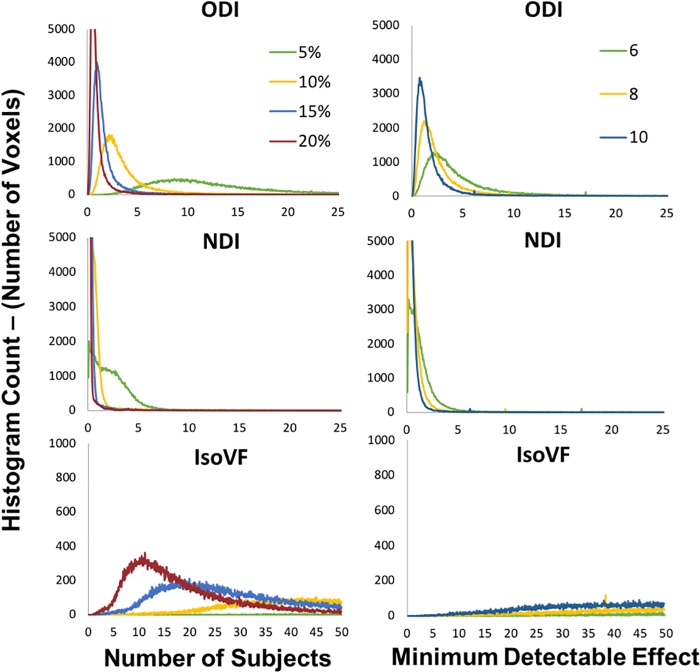
Fig 7. Whole brain voxel-wise histograms representing the i) number of subjects necessary to detect a statistically significant effect with a change in the given metric of 5%, 10%, 15% and 20% and ii) the minimum detectable effect with each metric under a scan-rescan study design given group sample sizes of 6, 8 and 10.
Note the varied scales for the IsoVF metric in each category as opposed to the ODI and NDI metrics.

