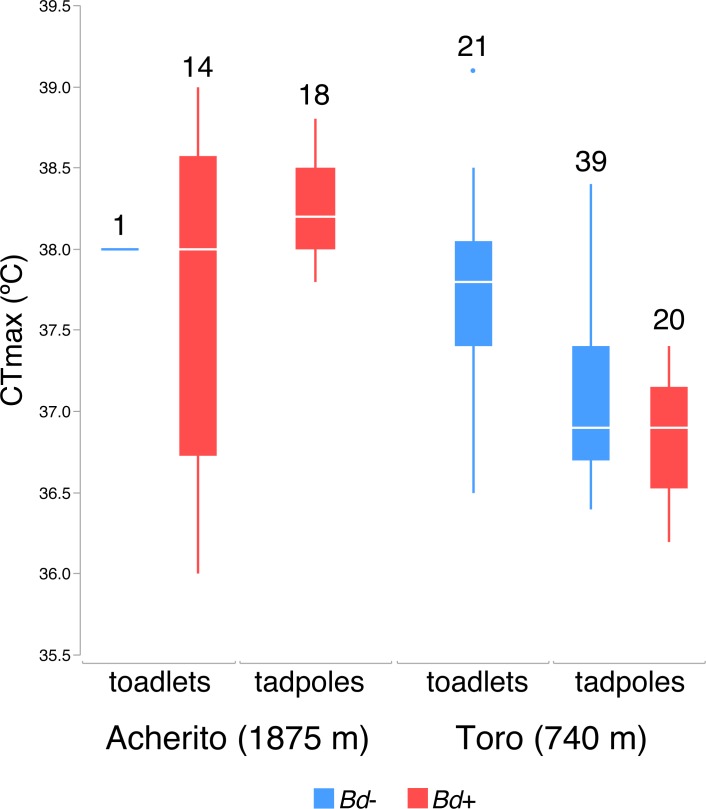
Fig 1. CTmax (°C) in both tadpoles and toadlets from the two studied localities, Acherito and Toro.
Uninfected animals appear in blue and Bd-infected animals are in red. Numbers above each box-plot are sample sizes. Horizontal lines depict medians, boxes represent interquartile ranges, whiskers extend to minima-maxima, dots show potential outliers.

