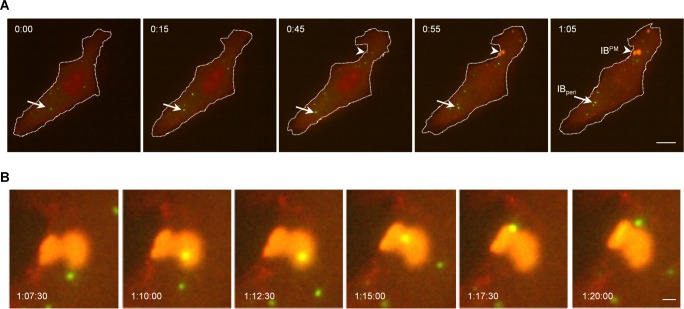
Fig 4. Formation of NiV IBperi and IBPM monitored by live cell imaging.
To follow IB formation in the presence of M over time, Vero76 cells were cotransfected with NiV N and NiV PeGFP together with mCherryNiV M and untagged NiV M (see Materials and Methods). At 14 h p.t., the live cell time-lapse experiments were started. Images were recorded with a Nikon TE2000 microscope. IBs (green) and M proteins (red) were detected via the PeGFP or the mCherryM autofluorescence, respectively. Pictures were taken every 50 sec and processed with Nikon NIS-Elements Microscope Imaging Software. (A) Merged images of the whole cell at different time points are shown. The plasma membrane is indicated by the dotted line. Arrows indicate M-negative IBs in the cytoplasm (green). Arrowheads indicate the site where M-positive IBs are formed at the plasma membrane (yellow, IBPM). Scale bar, 10 μm. (B) Magnification of an IBPM (indicated with an arrowhead in panel a). Scale bar, 1 μm. The full-length video is provided as S1 Movie. For comparison, S2 Movie shows IB formation in the absence of the M protein.

