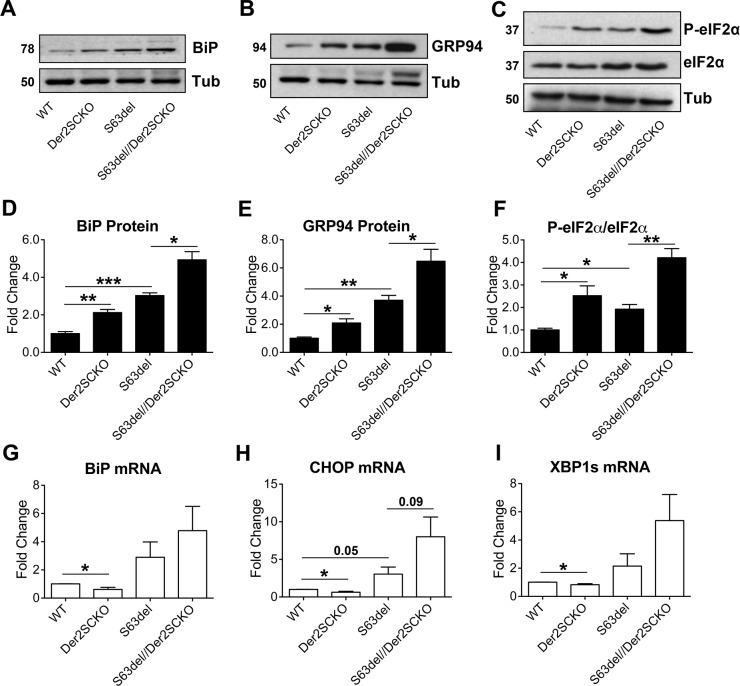
Fig 8. Measurement of ER stress/UPR levels in adult sciatic nerves.
(A-C) Western blot analysis for the ER stress/UPR markers BiP, GRP94 and P-eIF2α on 6 mo sciatic nerve lysates; β-Tubulin was used as loading control. One representative blot of three is shown. (D-E-F) Protein levels of BiP, GRP94 and P-eIF2α as measured by densitometric analysis. (G-H-I) qRT-PCR analysis for BiP, CHOP and spliced Xbp1 on 6 mo sciatic nerve extracts; the WT was used as the reference group. n = 5–6 independent RT per genotype. Error bars, SEM; *P<0,05, **P<0,01, ***P<0,001 by unpaired, 2-tails, Student’s t test.

