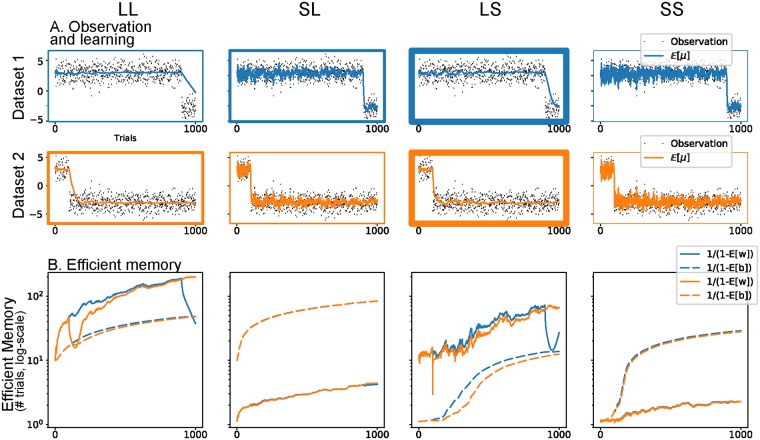
Fig 5. HAFVF predictions after a CC.
Each column displays the results of a specific hyperparameter setting. The blue traces and subplots represent the learning in an experiment with a long training, the orange traces and subplots show learning during a short training experiment. A. The stream of observations in the two training cases are shown together with the average posterior expected value of the mean . The box line width illustrates the ranking of the ELBO of each specific configuration for the dataset considered, with bolder borders corresponding to larger ELBOs. For both training conditions, the winning model (i.e. the model that best reflected the data) was the Long-Short memory model. This can be explained by the fact that the first two models trusted too much their initial knowledge after the CC, whereas the Short-Short learner was too cautious. B. Efficient memory (defined as ) for the first level (, plain line) and second level (, dashed line).

