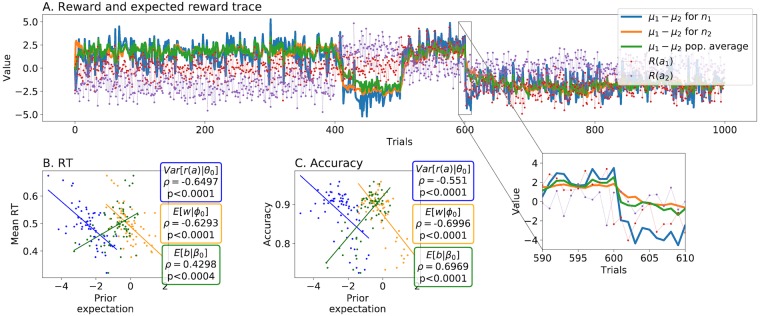
Fig 7. Simulated behavioral results.
A. The values of the two available rewards are shown with the dotted lines. The average drift rate μ1 − μ2 is shown in plain lines for two selected simulated subjects n1 and n2, and population average. Subject n1 was more flexible than subject n2 on both the first and the second level, making her more prone to adapt after the CCs, situated at trials 400, 500 and 600. This result is highlighted in the underlying zoomed box. B. The subjects’ expected variance (blue, log-valued) correlated negatively with the mean RT. The same correlation existed with the expected stability on the first level (orange, logit-valued), but not with the second level, which correlated positively with the average RT (green, logit-valued). Pearson correlation coefficient and respective p-values are shown in rounded boxes. C. Similarly, subjects with a higher expected variance and first-level stability had a lower average accuracy. Again, second-level memory expectation had the opposite effect.

