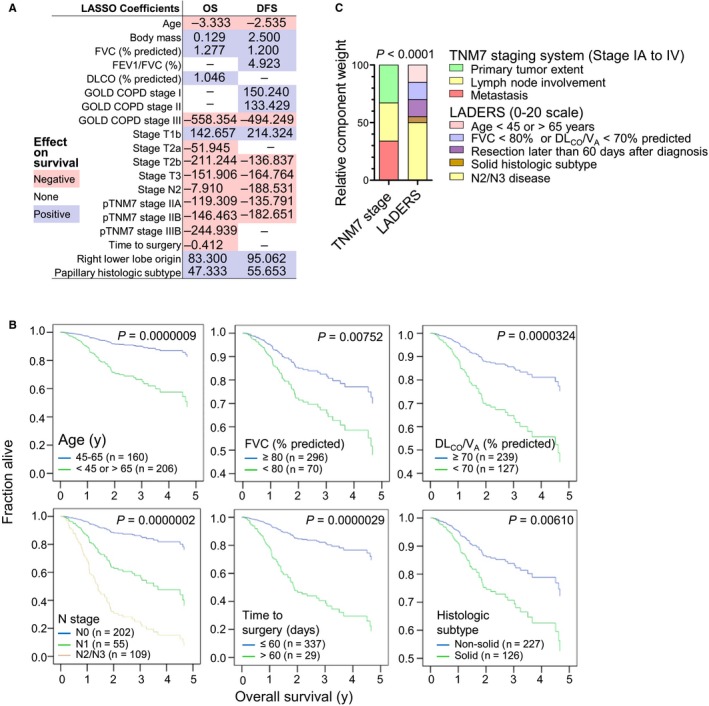
Figure 5.

Development of the locoregional lung adenocarcinoma death risk score (LADERS) from the GLAD derivation cohort. (A) Results of least absolute shrinkage and selection operator (LASSO) regression. Shown are regression coefficients for overall (OS) and disease‐free (DFS) survival and color‐coded direction of impact on survival. (B) Results of Cox regression showing proportional hazards survival plots for the six independent predictors of survival of GLAD, including sample sizes (n) and probability values (P). (C) Schematic representation of the components and relative weight of the variables that comprise LADERS compared with the TNM staging system, including χ 2 probability value (P). FVC, forced vital capacity; FEV 1, forced expiratory volume in 1 seconds; DLCO, uncorrected lung diffusion capacity for carbon monoxide; VA, alveolar ventilation; GOLD, global initiative for chronic obstructive lung disease; COPD, chronic obstructive pulmonary disease; TNM, tumor‐node‐metastasis staging system; p, pathologic
