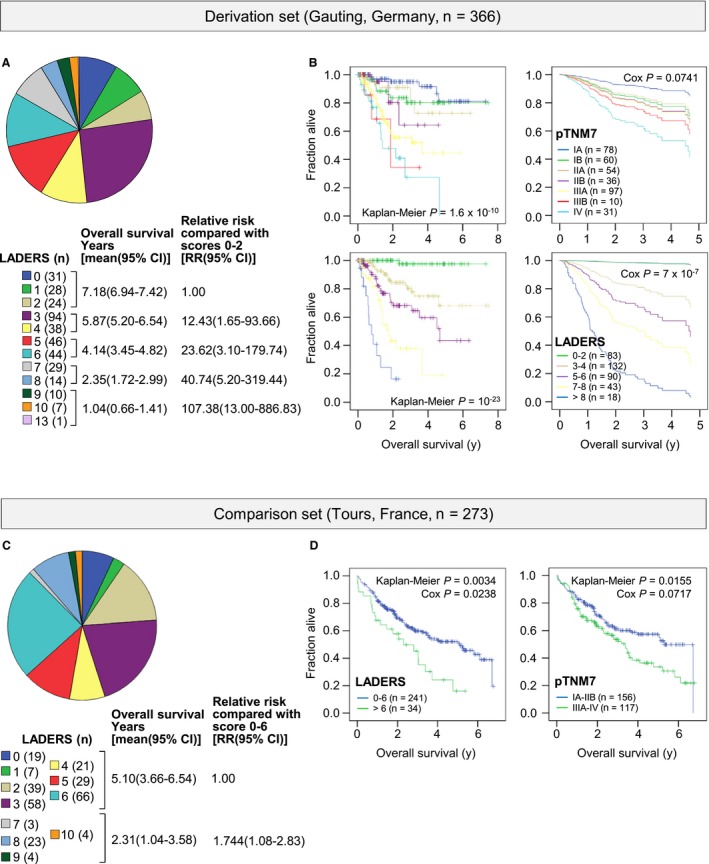
Figure 6.

Performance of LADERS and pTNM7 as prognosticators in two locoregional lung adenocarcinoma patient cohorts. (A, B) Results from the GLAD derivation cohort. (C, D) Results from the Tours validation cohort. (A, C) Shown are LADERS distribution pie charts and patient numbers (n), LADERS groupings employed, and mean (because median was not reached for low LADERS scores) Kaplan‐Meier survival and Cox proportional hazards estimates with 95% confidence intervals (95%CI) of LADERS groupings. (B, D) Shown are Kaplan‐Meier and Cox proportional hazards survival plots and overall log‐rank test and Cox probability values (P) for LADERS and pTNM7 groupings, showing that LADERS more accurately predicted death events. TNM, tumor‐node‐metastasis staging system; p, pathologic; LADERS, locoregional lung adenocarcinoma death risk score
