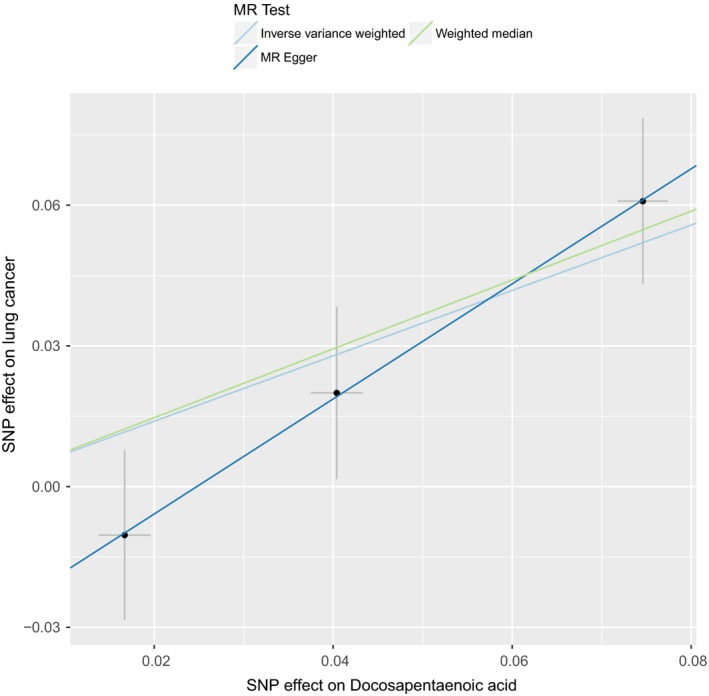
Figure 2.

Scatter plot of SNPs associated with DPA and their risk of lung cancer. A plot relating the SNP effect on DPA (x‐axis, SD units) and SNP effect on lung cancer (y‐axis, log(OR)) with 95% confidence intervals. The Mendelian randomization (MR) regression slopes of the lines correspond to the causal estimates using each of the three different methods (IVW approach, MR‐Egger, and weighted median). The light blue line shows causal regression estimates from IVW. The deep blue line shows causal regression estimates from MR‐Egger. The green line shows causal regression estimates from weighted median
