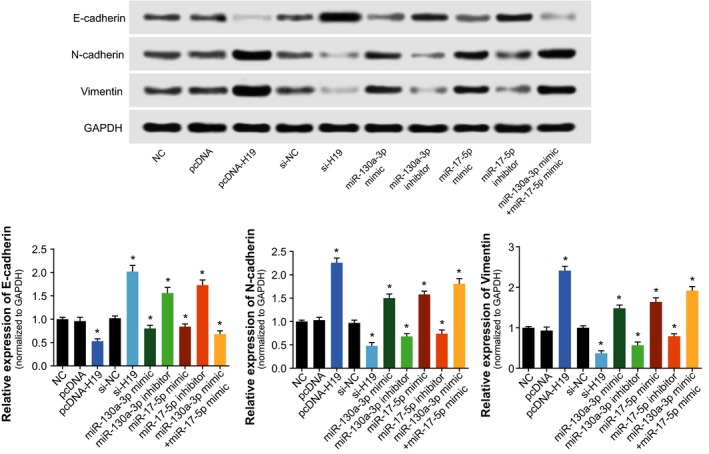
Figure 5.

The expression levels of endothelial‐mesenchymal transition (EMT)‐specific proteins (ie, E‐cadherin, N‐cadherin, and Vimentin) were determined among pcDNA H19, si‐H19, miR‐130a‐3p mimic, miR‐130a‐3p inhibitor, miR‐17‐5p mimic and miR‐17‐5p inhibitor groups within cardiac cancer cells. *ANOVA test: P < 0.05 when compared with NC. NC: negative control
