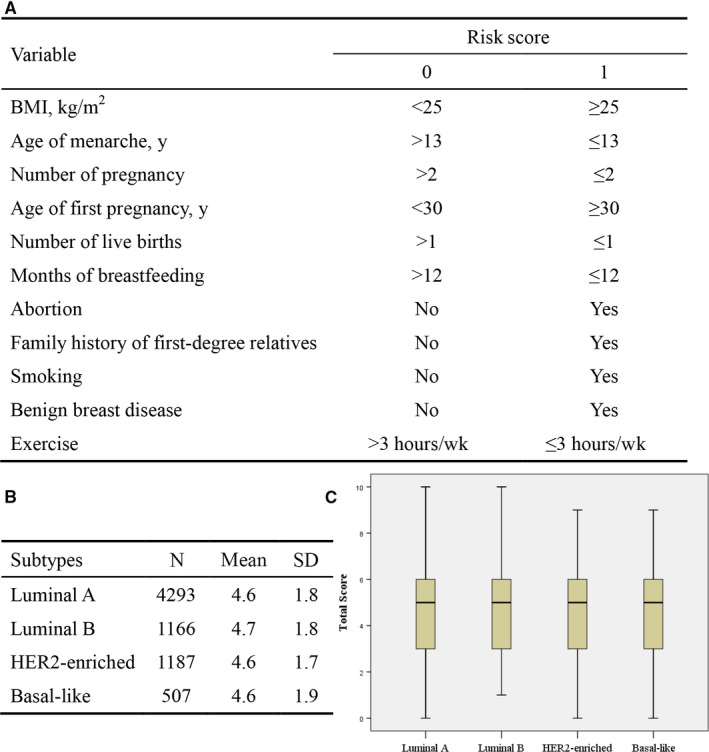
Figure 1.

Risk factors scoring. (A) Risk scoring system, each variable was divided into two categories, with 0 representing lower risk for breast cancer and 1 representing higher breast cancer risk (B) Average scores for the four subtypes (C) Total risk scores for the four subtypes were presented in a box plot
