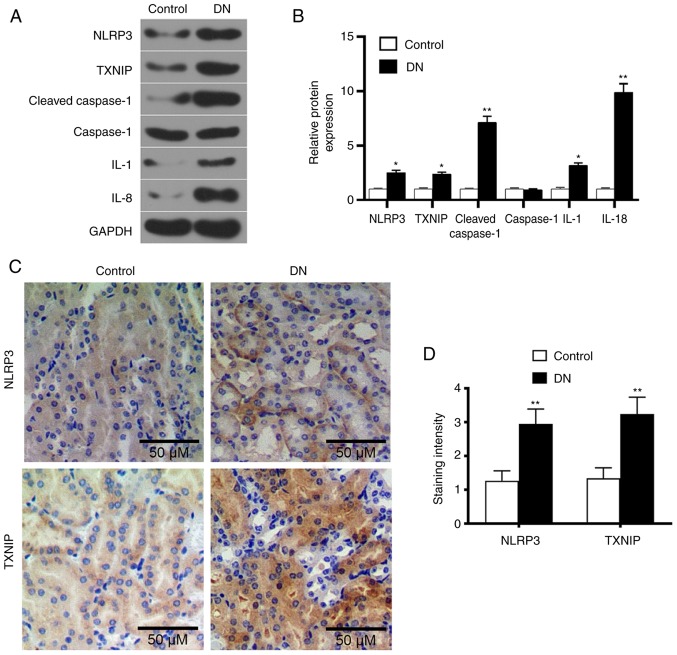
Figure 2.
Expression levels of TXNIP and NLRP3 inflammasome-associated proteins in renal tissue of DN rats. (A) Western blot images and (B) quantified protein levels of TXNIP, NLRP3, cleaved-caspase-1, caspase-1, IL-1 and IL-18 in the control and DN groups. (C) Streptavidin-peroxidase staining was used to detect the TXNIP and NLRP3 proteins expression in kidneys tissues (magnification, ×100), and (D) the quantified staining intensity is shown. *P<0.05 and **P<0.01, vs. control group. DN, diabetic nephropathy; TXNIP, thioredoxin interacting protein; NLRP3, NOD-like receptor protein 3; IL, interleukin.

