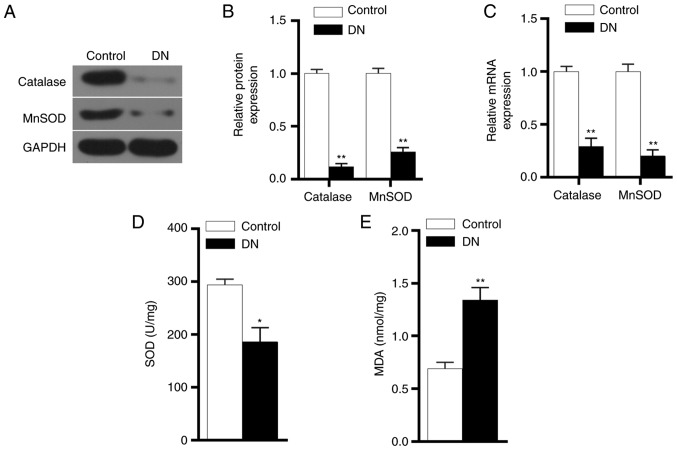
Figure 3.
Antioxidant gene expression levels in DN rats. (A) Western blots and (B) quantified protein expression levels of catalase and MnSOD proteins in renal tissues in the control and DN groups were detected by performing western blot analysis. (C) mRNA expression levels of catalase and MnSOD in renal tissues in the two groups were detected by reverse transcription-quantitative polymerase chain reaction. (D) SOD and (E) MDA concentrations in the two groups, detected using ELISA. *P<0.05 and **P<0.01 vs. control group. DN, diabetic nephropathy; MnSOD, manganese superoxide dismutase; MDA, malondialdehyde.

