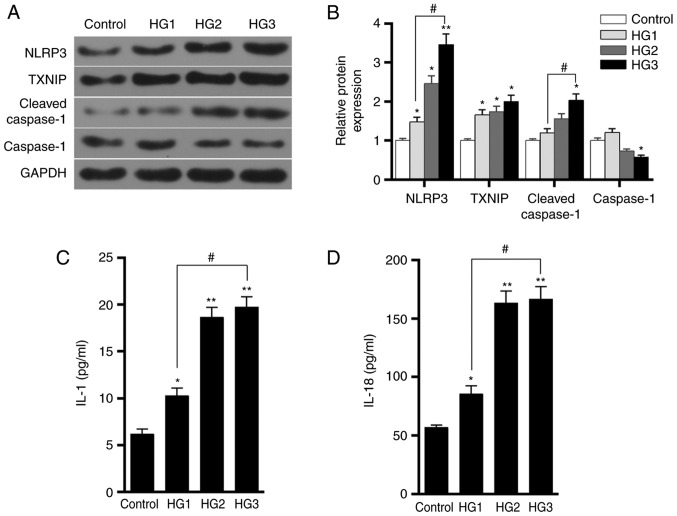
Figure 4.
Effects of different concentrations of glucose on TXNIP expression and the activation of NLRP3 inflammasome in HK-2 cells. (A) Western blots and (B) quantified expression levels of TXNIP, NLRP3, cleaved-caspase-1 and caspase-1 proteins in the control, HG1, HG2 and HG3 groups, which were treated with 5.5, 15, 30 and 50 mmol/l glucose, respectively. (C) IL-1 and (D) IL-18 expression levels in the four groups were tested using ELISA. *P<0.05 and **P<0.01, vs. control group; #P<0.05. TXNIP, thioredoxin interacting protein; NLRP3, NOD-like receptor protein 3; IL, interleukin.

