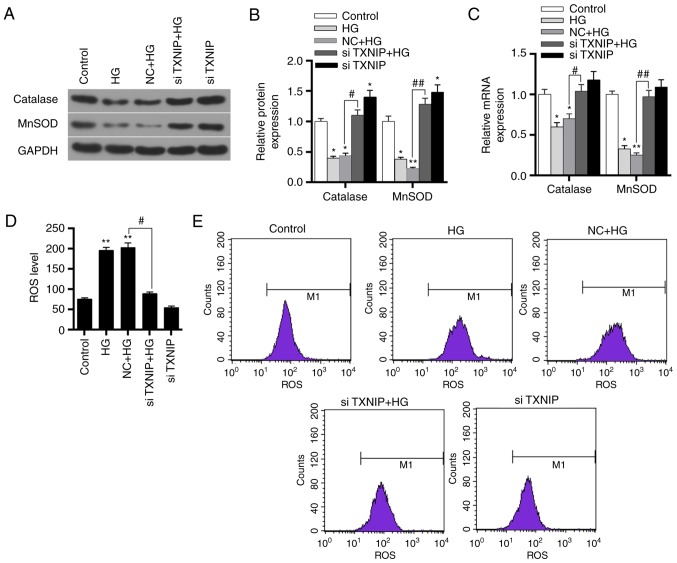
Figure 7.
Effects of TXNIP gene silencing on antioxidant gene expression and ROS levels in HK-2 cells. (A) Western blots and (B) quantified protein expression levels of catalase and MnSOD in the control, HG, NC + HG, siTXNIP + HG and siTXNIP groups, detected using western blot analysis. (C) mRNA expression levels of catalase and MnSOD in the different groups, detected using reverse transcription-quantitative polymerase chain reaction. (D) ROS levels in each group and (E) flow cytometry applied to detect these levels. *P<0.05 and **P<0.01, vs. control group; #P<0.05 and ##P<0.01. TXNIP, thioredoxin interacting protein; ROS, reactive oxygen species; HG, high glucose; NC, negative control siRNA; si-, small interfering RNA.

