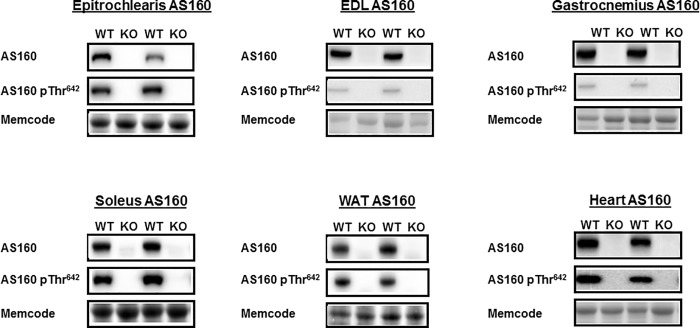
Fig 1. Total AS160 abundance and AS160 phosphorylation (pAS160 Thr642) in tissues collected immediately after the hyperinsulinemic-euglycemic clamp performed in WT and KO rats.
EDL, extensor digitorum longus; WAT, white adipose tissue. Images of representative immunoblots and loading controls (Memcode protein stain) are provided for each group. Neither total AS160 nor pAS160 Thr642 was detectable in any of the tissues from KO rats. N = 5–6 rats per group.

