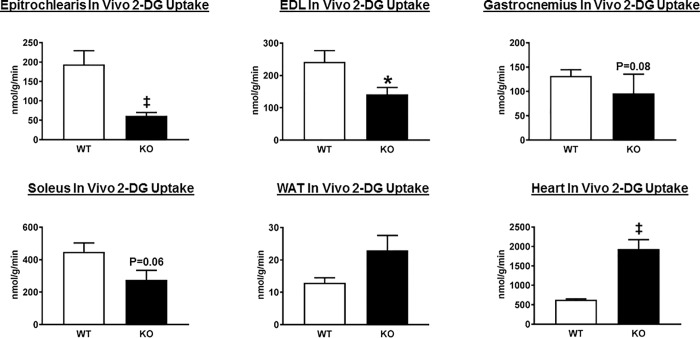
Fig 3. In vivo tissue 2-deoxyglucose (2-DG) uptake in wildtype (WT; open bars) and AS160-KO (KO; filled bars) rats from the hyperinsulinemic-euglycemic clamp experiment.
Extensor digitorum longus (EDL); White adipose tissue (WAT). Data were analyzed by Student’s t-test. *P<0.05 and ‡P<0.005 for WT versus KO rats. Values are means ± SEM. N = 5–6 rats per group.

