Abstract
The subarachnoid space is a layer in the meninges that surrounds the brain and is filled with trabeculae and cerebrospinal fluid. Quantifying the volume and thickness of the subarachnoid space is of interest in order to study the pathogenesis of neurodegenerative diseases and compare with healthy subjects. We present an automatic method to reconstruct the subarachnoid space with subvoxel accuracy using a nested deformable model. The method initializes the deformable model using the convex hull of the union of the outer surfaces of the cerebrum, cerebellum and brainstem. A region force is derived from the subject’s Tl-weighted and T2-weighted MRI to drive the deformable model to the outer surface of the subarachnoid space. The proposed method is compared to a semi-automatic delineation from the subject’s T2-weighted MRI and an existing multi-atlas-based method. A small pilot study comparing the volume and thickness measurements in a set of age-matched subjects with normal pressure hydrocephalus and healthy controls is presented to show the efficacy of the proposed method.
Keywords: MRI, subarachnoid space, deformable models, normal pressure hydrocephalus
1. INTRODUCTION
The subarachnoid space is a layer between the arachnoid mater and pia mater in the meninges that surrounds the brain. The subarachnoid space is filled with trabeculae, which extend from the arachnoid mater to the pia mater, and cerebrospinal fluid (CSF). The subarachnoid space plays a role in dampening brain motion and circulating CSF, and the volume of the subarachnoid space is known to increase in normal aging.1 However, in patients with certain neurodegenerative diseases, the volume of the subarachnoid space is smaller.2 One such disease is normal pressure hydrocephalus (NPH), in which the flow of CSF is disrupted and the ventricles become enlarged. This causes the brain shape to become distorted, leads to cognitive impairment, and results in a change in the volume of the subarachnoid space.2 To better understand the subarachnoid space in healthy individuals and patients with a neurodegenerative disease, there is a need for an automatic method to reconstruct the subarachnoid space in vivo from magnetic resonance images (MRI). While CSF is difficult to distinguish from bone in Tl-weighted (Tl-w) MRI because they both have dark intensities, CSF in the subarachnoid space and ventricles have bright intensities in T2-weighted (T2-w) MRI, as shown in Fig. 1 with yellow arrows pointing at the subarachnoid space.
Figure 1:

Appearance of subarachnoid space in an axial slice from a (a) T1-w MRI and (b) T2-w MRI. Yellow arrows point at the CSF in the subarachnoid space.
Using multiple MRI modalities, the volume of the subarachnoid space in healthy versus diseased subjects has been previously studied using semi-automatic methods. Existing attempts to quantify the volume of the subarachnoid space1,2 have automatically labeled voxels as CSF from MRI but required the user to manually separate the ventricles from the rest of the subarachnoid space. Blatter et al.1 examined a set of healthy subjects across five decades and found that the subarachnoid space volume increased with age among both the male and female population. Matsumae at al.2 compared the subarachnoid space volume in a set of patients with NPH and healthy controls. The subarachnoid space volume was slightly smaller in NPH patients and this difference was statistically significant after normalizing by intracranial volume. The disadvantage with existing methods is that they are constrained to labeling voxels on a voxel grid. In areas where the subarachnoid space is thin, voxels are not classified as CSF, resulting in gaps in the subarachnoid space that are not biologically plausible. Deformable geometric models3 have been used to find the inner and outer cortical surfaces with subvoxel accuracy,4 but have yet to be used to reconstruct the subarachnoid space surfaces.
2. NEW WORK TO BE PRESENTED
In this work we present an automatic method to reconstruct the inner and outer subarachnoid space surfaces using a nested topology-preserving geometric deformable model (NTGDM).3 The inner subarachnoid space surface is taken to be the outer cortical surfaces found using an existing method.4 The deformable model is initialized by a convex hull of the inner subarachnoid space surface and is driven by a region force that is computed from the T1-w and T2-w MR images to find the edge of the outer subarachnoid space surface. We evaluate our method by computing the Dice coefficient with a semi-automatic delineation protocol that uses the T2-w MRI. The method is compared with a multi-atlas voxel labeling method designed for subjects with enlarged ventricles. Finally, we present a small pilot study of four age-matched subjects with NPH and healthy controls to examine differences in subarachnoid space volume and thickness.
3. METHODS
3.1. Data and preprocessing
The subject’s T1-w MRI is bias corrected,5 affinely registered to an atlas in MNI space, and skull stripped.6 An initial multi-atlas segmentation of cortical and subcortical structures is found by registering 30 T1-w MRI atlases with manual segmentations from Neuromorphometrics Inc. (http://www.neuromorphometrics.com/) using SyN7 and fusing the deformed segmentations by voxelwise majority vote. The inner, central, and outer cortical surfaces are reconstructed using an NTGDM3 and the initial multi-atlas segmentation is refined to ensure consistency with the inner and outer cortical surfaces.4 The outer surface of the cerebellum is reconstructed in a similar manner. The subject’s T2-w MRI is rigidly registered to the preprocessed T1-w MRI and bias corrected.
3.2. Nested TGDM
An NTGDM3 is used to reconstruct the outer subarachnoid space surface. We take the union of the outer surfaces of the cerebrum, cerebellum and brainstem, which were found in the preprocessing step4 and henceforth referred to as the inner subarachnoid surface. The convex hull of the inner subarachnoid surface is used to initialize a level set function Φ(x, t), where x is a voxel location and t represents the temporal evolution of the level set. A region force R(x) is computed from the subject’s T1-w and T2-w MRI to drive the level set Φ(x, t) to the boundary of the subarachnoid space. The evolution of the level set Φ is prescribed by the following partial differential equation8
| (1) |
where Φt is the partial derivative of ∇Φ with respect to t, ∇Φ is the spatial gradient of Φ and Fprop, Fcurv, and Fadv are the propagation, curvature, and advection speed function, respectively. In this work, we use a propagation speed function proportional to the region force R(x), a curvature speed function proportional to the mean curvature of the surface, and no advection speed function.
An additional topology preserving constraint prevents the surface from changing topology.3 The nested constraint is enforced by preventing Φ(x) from becoming larger than Φin (x), where Φin is the level set derived from the inner surface of the subarachnoid space. Fig. 2 shows a summary of the steps to find the outer surface of the subarachnoid space given a Tl-w MRI (Fig. 2(a)) and T2-w MRI (Fig. 2(b)).
Figure 2:

Axial view of the steps in the proposed subarachnoid space reconstruction method using a subject’s (a) Tl-w MRI and (b) T2-w MRI: (c) the convex hull (cyan contour) of the inner subarachnoid space surface (yellow contour) is used as the initialization for the deformable model; (d) the region force to drive the deformable model to the outer subarachnoid surface is found using the Tl-w and T2-w MRI; and (e) the outer subarachnoid space (green contour) is shown.
3.2.1. Initialization
The initial level set function Φ(x, 0) is computed by taking the convex hull9 of the inner subarachnoid surface and computing the signed distance. Fig. 2(c) shows the inner subarachnoid surface in yellow and the convex hull in cyan.
3.2.2. Region force construction
The region force R(x) is computed using a multi-modal skull stripping method by Roy et al.6 Briefly, six atlases, each with a co-registered Tl-w MRI, T2-w MRI, and manually delineated binary mask containing the brain and subarachnoid space, are transformed into subject space by deformably registering7 the atlas Tl-w MRI to the subject’s Tl-w MRI. The transformed atlas masks are averaged and thresholded to produce an initial mask.
At each voxel x in a narrow band around the edge of the initial mask, a sparse patch matching criteria10 is used to approximate a patch at x as a sparse linear combination of nearby patches from the atlases,
| (2) |
where s(x) is the subject patch, A(x) is the atlas patches, v(x) is a sparse vector, and this equation is solved for v(x) using elastic net regularization. A patch is defined as the collection of voxels from the Tl-w and T2-w MRI in a neighborhood of size s × s × s centered at x and concatenated into a single vector. The set of atlas patches A(x) is formed by extracting a patch at each voxel in a search space Nx of size S × S × S around voxel x from each atlas. The set B(x) is formed by extracting the value of the binary mask associated with the center voxel of each atlas patch in A(x).
The result of Eq. 2 is used to compute the membership μ(x) as a sparse combination of elements in B (x),
| (3) |
A smooth region force R(x) is produced by thresholding μ(x), dilating, and convolving with a Gaussian kernel. Fig 2(d) shows the region force and Fig 2(e) shows the final subarachnoid space produced by the NTGDM.
4. EXPERIMENTS AND RESULTS
To validate the proposed method, the subarachnoid space was found by following a semi-automatic delineation protocol that uses the subject’s T2-w MRI. A region growing tool was applied to each axial slice in the T2-w MRI. The seed point was in the subarachnoid space and the region growing tolerance was manually adjusted on a per-slice basis to avoid segmenting the gray and white matter. The ventricles were manually removed from the final delineation if they were erroneously segmented by the region growing tool. In this work, this delineation was used as a proxy for the ground truth and eight subjects were delineated, four subjects from an ongoing study of NPH and four healthy controls from the Baltimore Longitudinal Study of Aging.
The proposed method is compared to a multi-atlas segmentation method, RUDOLPH (RobUst DictiOnary- learning and Label Propagation Hybrid),11,12 which is designed for subjects with enlarged ventricles and labels cortical CSF on a voxel grid. The Dice coefficient between the semi-automatic delineation and automatic methods were computed, which is given by
| (4) |
where A and B are the binary masks produced by the two methods. The range of the Dice coefficient is between 0 and 1, where a higher Dice coefficient is better. Because the Dice coefficient is based on the overlap between binary masks, the inner and outer subarachnoid space surfaces produced by the proposed method were converted into a binary mask of the subarachnoid space on a voxel grid. This allows for a more appropriate comparison because both the semi-automatic delineation and RUDOLPH produce binary masks on voxel grids.
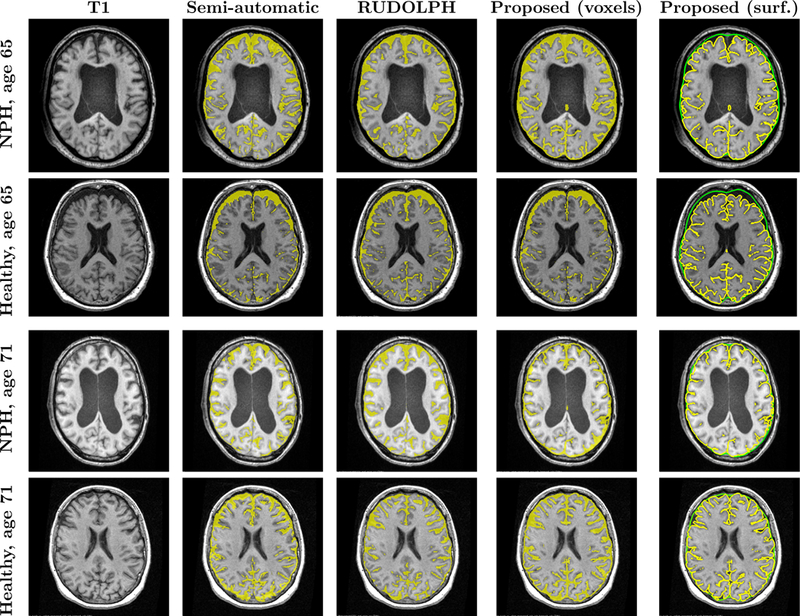
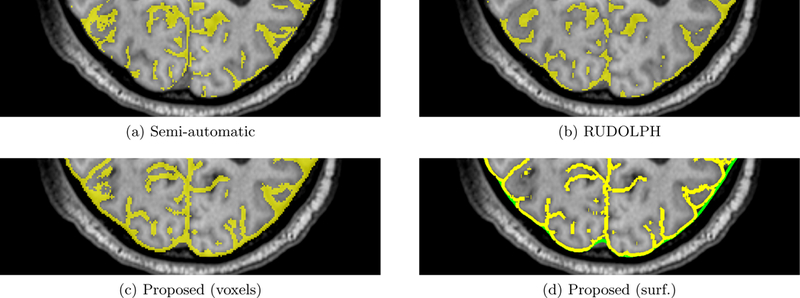
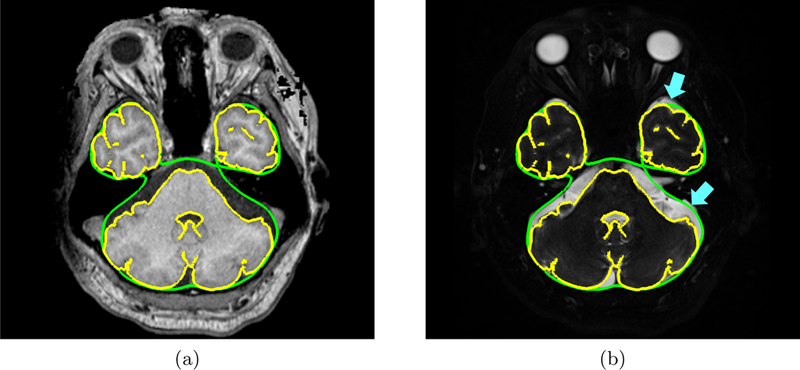
Fig. 3 shows the results overlaid on an axial slice of the T1-w MRI for two sets of age-matched subject pairs. In the semi-automatic and RUDOLPH methods, the subarachnoid space is not contiguous, in particular in the posterior region of the head. However, gaps in the subarachnoid space are not biologically possible because it completely surrounds the brain. Fig. 4 shows an example of gaps produced by the semi-automatic and RUDOLPH methods in the 65-year-old NPH patient. This does not occur in the proposed method, as the NTGDM ensures that the subarachnoid space surrounds the brain and is contiguous. Areas where the proposed method does not perform well are in the inferior region of the head near the cerebellum because of errors in the region force. Fig. 5 shows an example of such errors on an axial slice of a T1-w and T2-w MRI. In particular, the T2-w MRI shows areas of CSF occuring outside of the subarachnoid space, as pointed out by blue arrows in Fig. 5(b). In Table 1, we report the Dice coefficient between the semi-automatic delineation and automatic methods. Even though the proposed method has a worse Dice coefficient than RUDOLPH, this is explained by the proposed method producing a subarachnoid space that is contiguous in regions where both the semi-automatic and RUDOLPH methods are not.
Figure 3:

Comparison of semi-automatic and automatic methods, showing an axial slice of the subject’s T1, semi-automatic method result, RUDOLPH result, the proposed method after conversion to a binary map on a voxel grid, and proposed method as an inner (yellow) and outer (green) subarachnoid surface.
Figure 4:

Comparison of semi-automatic and automatic methods in the posterior region of the 65-year-old NPH subject’s head, showing a portion of an axial slice of (a) the semi-automatic method result, (b) RUDOLPH result, (c) the proposed method after conversion to a binary map on a voxel grid, and (d) proposed method as an inner (yellow) and outer (green) subarachnoid surface. Gaps in the subarachnoid space which are not biologically possible occur in the semi-automatic and RUDOLPH results.
Figure 5:

Axial view of an inferior slice of an NPH subject’s (a) T1-w MRI and (b) T2-w MRI with the inner subarachnoid space surface (yellow contour) and outer subarachnoid space (green contour) overlaid. The blue arrows point to areas of CSF in the inferior region of the head that were not included in the subarachnoid space generated by the proposed method.
Table 1:
Mean (standard deviation) Dice coefficient of the subarachnoid space across 10 subjects using the semi-automatic segmentation as ground truth.
| RUDOLPH | Proposed (voxels) | |
|---|---|---|
| Dice coefficient | 0.68 (±0.07) | 0.54 (±0.10) |
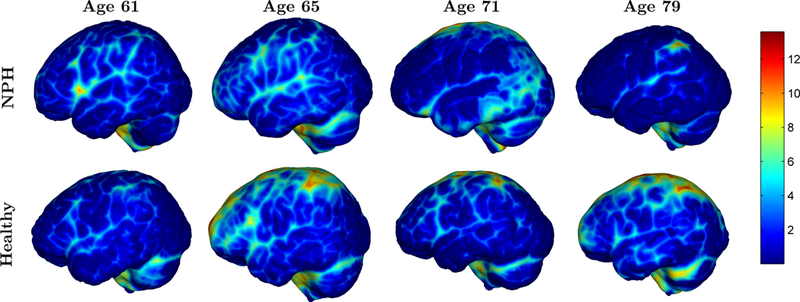
In Table 2, we report the subarachnoid space volumes for all the methods including the proposed method (denoted as Prop.) on a voxel grid and as surfaces. The subarachnoid space produced by all methods are larger in the healthy subjects compared to the NPH subjects, though this difference is smallest in the semi-automatic and RUDOLPH methods. We present the thickness of the subarachnoid space mapped onto the outer subarachnoid space surface for all age-matched pairs in Fig. 6. The thicknesses are calculated at each point on the outer surface as the shortest distance to the inner surface. Qualitatively, the thickness maps are consistent with the results in Table 2 showing that the healthy controls have thicker subarachnoid space than the age-matched NPH patients. The overall pattern of the subarachnoid thickness is different for each subject.
Table 2:
Subarachnoid space volume normalized by intracranial volume for 8 subjects.
| Subj. | Age | Semi-auto. | RUDOLPH | Prop. (voxels) | Prop. (surface) | |
|---|---|---|---|---|---|---|
| 1 | 61 | 0.188 | 0.229 | 0.167 | 0.133 | |
| 2 | 65 | 0.218 | 0.202 | 0.166 | 0.133 | |
| NPH | 3 | 71 | 0.155 | 0.218 | 0.182 | 0.154 |
| 4 | 83 | 0.210 | 0.252 | 0.126 | 0.088 | |
| Mean | - | 0.193 | 0.225 | 0.160 | 0.127 | |
| 5 | 61 | 0.118 | 0.214 | 0.167 | 0.127 | |
| 6 | 65 | 0.191 | 0.266 | 0.264 | 0.230 | |
| Healthy | 7 | 71 | 0.250 | 0.236 | 0.208 | 0.168 |
| 8 | 83 | 0.244 | 0.296 | 0.286 | 0.256 | |
| Mean | - | 0.201 | 0.253 | 0.231 | 0.196 | |
Figure 6:

Thickness maps (in mm) for all sets of age-matched NPH and healthy control pairs.
5. CONCLUSION
We present a new method for reconstructing the subarachnoid space with subvoxel accuracy using a deformable model. The method initializes a deformable model using the convex hull of the union of the outer surfaces of the cerebrum, cerebellum, and brainstem. A region force is derived from the subject’s T1-w and T2-w MRI to drive the deformable model to the outer surface of the subarachnoid space. The proposed method was compared to an existing multi-atlas-based method using the Dice coefficient. Finally, volume measurements and thickness maps are presented in a set of age-matched subjects with NPH and healthy controls. Future work includes parcellation of the subarachnoid space to compute the volume and thickness of the subarachnoid space around certain major sulci and regions and expanding the scope of the study of NPH subjects to include a larger number of subjects.
ACKNOWLEDGMENTS
This project is funded by the NIH/NINDS through grants R01-NS055951 and R21-NS096497, the Department of Defense in the Center for Neuroscience and Regenerative Medicine, National Multiple Sclerosis Society grant RG-1507-05243, and RANNIS (The Icelandic Centre for Research) grant 173942-051.
REFERENCES
- [1].Blatter DD, Bigler ED, Gale SD, Johnson SC, Anderson CV, Burnett BM, Parker N, Kurth S, and Horn SD, “Quantitative volumetric analysis of brain MR: normative database spanning 5 decades of life,” American Journal of Neuroradiology 16(2), 241–251 (1995). [PMC free article] [PubMed] [Google Scholar]
- [2].Matsumae M, Kikinis R, Mórocz I, Lorenzo AV, Albert MS, Black PM, and Jolesz FA, “Intracranial compartment volumes in patients with enlarged ventricles assessed by magnetic resonance- based image processing,” Journal of Neurosurgery 84(6), 972–981 (1996). [DOI] [PubMed] [Google Scholar]
- [3].Han X, Pham DL, Tosun D, Rettmann ME, Xu C, and Prince JL, “CRUISE: Cortical reconstruction using implicit surface evolution,” Neuroimage 23(3), 997–1012 (2004). [DOI] [PubMed] [Google Scholar]
- [4].Huo Y, Plassard AJ, Carass A, Resnick SM, Pham DL, Prince JL, and Landman BA, “Consistent cortical reconstruction and multi-atlas brain segmentation,” Neuroimage 138, 197–210 (2016). [DOI] [PMC free article] [PubMed] [Google Scholar]
- [5].Tustison NJ, Avants BB, Cook PA, Zheng Y, Egan A, Yushkevich PA, and Gee JC, “N4ITK: Improved N3 Bias Correction,” IEEE Trans. Med. Imag. 29, 1310–1320 (June 2010). [DOI] [PMC free article] [PubMed] [Google Scholar]
- [6].Roy S, Butman JA, and Pham DL, “Robust skull stripping using multiple MR image contrasts insensitive to pathology,” Neuroimage 146, 132–147 (2017). [DOI] [PMC free article] [PubMed] [Google Scholar]
- [7].Avants BB, Epstein CL, Grossman M, and Gee JC, “Symmetric diffeomorphic image registration with cross-correlation: Evaluating automated labeling of elderly and neurodegenerative brain,” Medical Image Analysis 12(1), 26–41 (2008). [DOI] [PMC free article] [PubMed] [Google Scholar]
- [8].Sethian JA, [Level set methods and fast marching methods: evolving interfaces in computational geometry, fluid mechanics, computer vision, and materials science], vol. 3, Cambridge university press; (1999). [Google Scholar]
- [9].Barber CB, Dobkin DP, and Huhdanpaa H, “The Quickhull algorithm for convex hulls,” ACM Trans. Math. Softw. 22, 469–483 (Dec. 1996). [Google Scholar]
- [10].Roy S, He Q, Sweeney E, Carass A, Reich DS, Prince JL, and Pham DL, “Subject-specific sparse dictionary learning for atlas-based brain MRI segmentation,” IEEE Journal of Biomedical and Health Informatics 19, 1598–1609 (Sept 2015). [DOI] [PMC free article] [PubMed] [Google Scholar]
- [11].Ellingsen LM, Roy S, Carass A, Blitz AM, Pham DL, and Prince JL, “Segmentation and labeling of the ventricular system in normal pressure hydrocephalus using patch-based tissue classification and multi-atlas labeling,” Proc. SPIE 9784, 97840G-97840G–7 (2016). [DOI] [PMC free article] [PubMed] [Google Scholar]
- [12].Carass A, Shao M, Li X, Dewey BE, Blitz AM, Roy S, Pham DL, Prince JL, and Ellingsen LM, “Whole brain parcellation with pathology: Validation on ventriculomegaly patients,” in [Patch-Based Techniques in Medical Imaging: Third International Workshop, Patch-MI 2017, Held in Conjunction with MICCAI 2017, Quebec City, QC, Canada, September 14, 2017, [DOI] [PMC free article] [PubMed] [Google Scholar]


