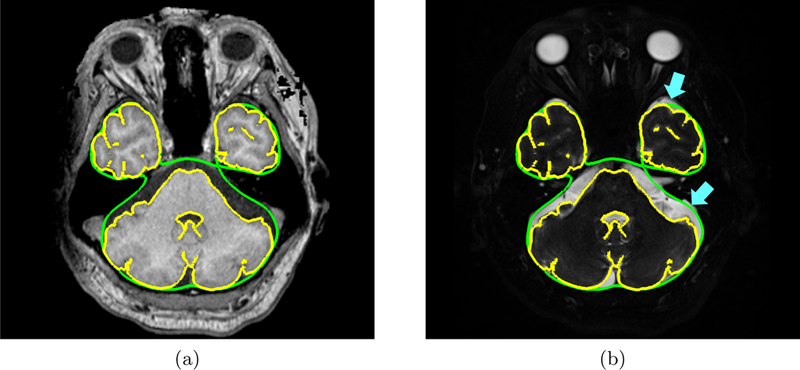
Figure 5:

Axial view of an inferior slice of an NPH subject’s (a) T1-w MRI and (b) T2-w MRI with the inner subarachnoid space surface (yellow contour) and outer subarachnoid space (green contour) overlaid. The blue arrows point to areas of CSF in the inferior region of the head that were not included in the subarachnoid space generated by the proposed method.
