. 2019 Apr 5;8:e42498. doi: 10.7554/eLife.42498

Figure 2. Blue light intensity titrates binding half-life, CAR occupancy and DAG levels.

(A) In vitro measurements of blue light intensity-based control of LOV2-Zdk binding half-life. SLBs functionalized with LOV2 were combined with soluble, dye-labeled Zdk. After washing out free Zdk, Zdk dissociation was measured upon acute illumination with different intensities of blue light using TIRF microscopy. (B) Blue light intensity enforces LOV2-Zdk binding half-lives from ten seconds to hundreds of milliseconds. Binding half-lives were determined by fitting a single exponential decay to the traces shown in A). Data was fit using a two-step unbinding model (solid black line), consisting of light-dependent excitation of LOV2 followed by light-independent release of Zdk. (C) Time course showing that intermediate light levels modulate ligand binding half-lives (bottom), titrate receptor occupancy (top), and induce DAG accumulation in Jurkat cells (middle). Asterisks in middle panel highlight small but detectable increases in DAG levels to weak stimuli. n = 31 cells. Mean with 95% CI (two-sided Student’s t-test).
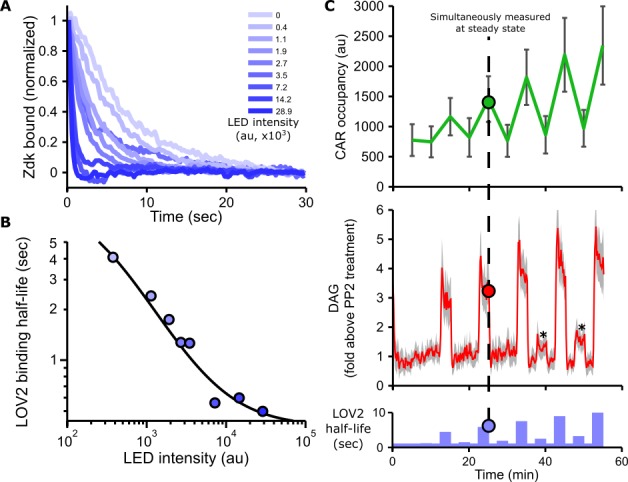
Figure 2.

Figure 2—figure supplement 1. Purification of LOV2 and Zdk1.
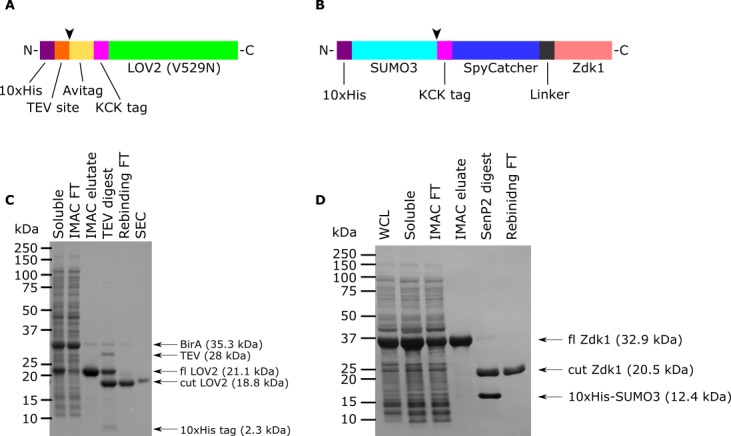
Figure 2—figure supplement 1.

(A) Schematic of LOV2 construct expressed in E. coli. Arrow indicates TEV protease cleavage site. The Avitag is biotinylated by BirA, which was co-expressed in the cells. KCK tag used for maleimide dye labeling. Not to scale. (B) Schematic of Zdk1 construct expressed in E. coli. SenP2 cleaves after the SUMO3 domain (arrow). Not to scale. (C and D) Samples from different stages of the protein purifications were run by SDS-PAGE and stained with Coomassie Blue R250. WCL: whole cell lysate. Soluble: soluble fraction after ultracentrifugation of the whole cell lysate. IMAC FT: Immobilized metal affinity chromatography flow through. IMAC eluate: Protein eluted from the IMAC column. Rebinding FT: Protein flow through after recirculating the SenP2 digest over an IMAC column. SEC: Size exclusion chromatography. fl: full length.

Figure 2—figure supplement 2. Calculating DAG levels.
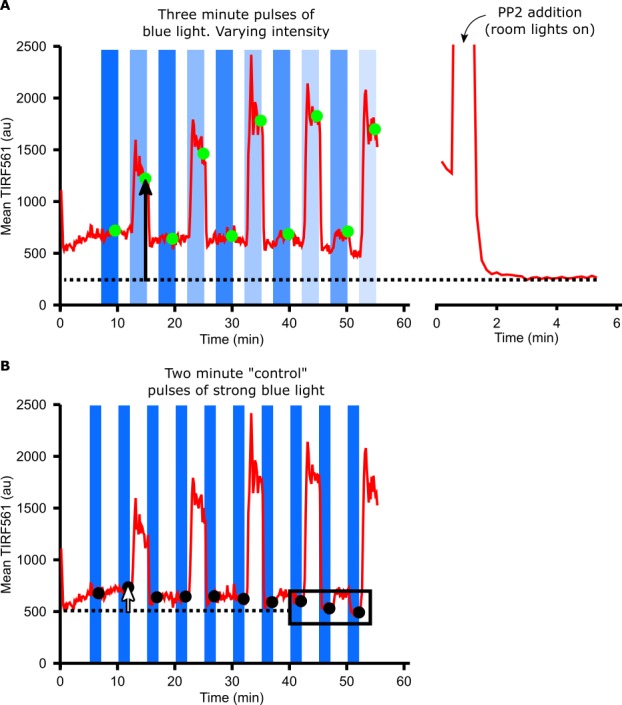
Figure 2—figure supplement 2.

(A) Mean TIRF561 pixel intensities within the cell mask are plotted over time. TIRF561 signals at steady state (green circles) are calculated as the average of frames taken during the last minute of a three-minute hold in blue light. DAG levels (black arrow) are measured as the difference between the TIRF561 signal at steady state compared to after treatment with PP2 (dotted line). (B) Changes in the baseline TIRF561 signal can impair our ability to detect small increases in DAG levels. To correct for this, the TIRF561 signal was measured after two-minute ‘control’ pulses of identical, higher intensity blue light (black circles). Baseline changes (white arrow) were measured as the difference between the TIRF561 signal after a control pulse of blue light and the average of the last three control pulses (dotted line). This baseline drift was subtracted from the DAG levels measured in A) to yield the raw, unnormalized DAG level of each cell.

Figure 2—figure supplement 3. Calculating CAR occupancy.

Figure 2—figure supplement 3.

(A) RICM images were used to construct a cell mask and a local background mask. When used to mask the TIRF488 images, the fluorescence within the cell mask is the sum of freely diffusing LOV2 and LOV2 bound to the CAR, while the fluorescence within the background mask reflects freely diffusing LOV2 only. The CAR occupancy is calculated as the difference in mean TIRF488 pixel intensity between the cell mask region and the background region. (B) The measured CAR occupancy is affected by both photobleaching and power fluctuations in the 488 nm laser. To correct for this, integrated whole field TIRF488 intensities were measured over time and normalized to their mean values. Initial CAR occupancies measured in A) were divided by the normalized whole-field TIRF488 values to yield the final CAR occupancy measurement.