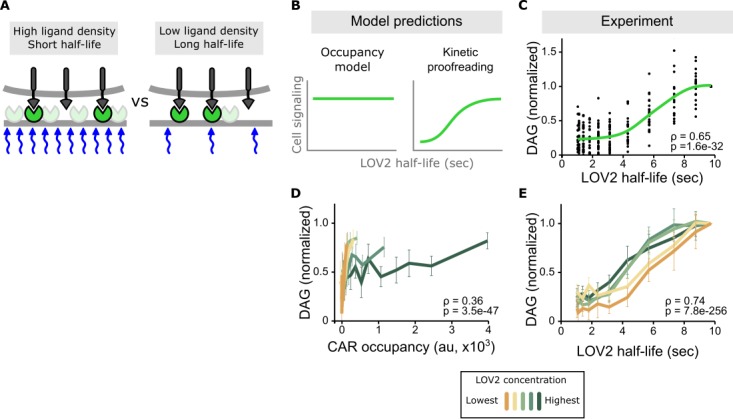
Figure 3. Binding half-life, not receptor occupancy, dominates CAR signaling.
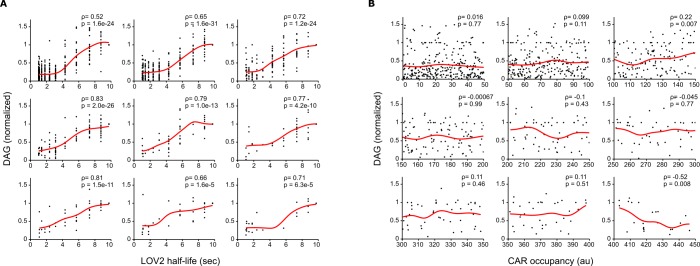
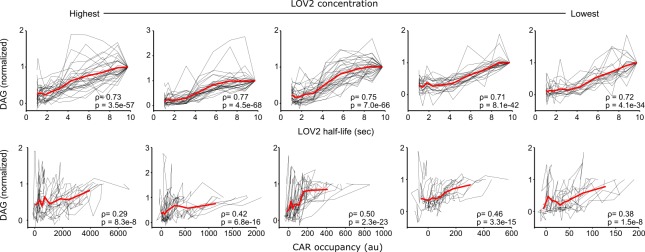
(A) A cell exposed to a high LOV2 density but a short binding half-life can have the same receptor occupancy as a cell exposed to a low LOV2 density but a long binding half-life. (B) At constant receptor occupancy, an occupancy model predicts binding half-life should have no effect on signaling, while kinetic proofreading predicts that increasing binding half-life should increase signaling. (C) At constant receptor occupancy, increasing ligand binding half-life increases DAG signaling, as shown by both non-parametric kernel smoothing regression (green line) and Spearman’s correlation coefficient (ρ). Each black dot is a single cell measurement obtained from multiple experiments over a range of LOV2 concentrations. (D and E) During individual experiments, there is a fixed concentration of LOV2, meaning that both receptor occupancy and binding half-life change in response to blue-light. We measured Spearman’s correlation coefficient to ask whether DAG levels were best described as a function of receptor occupancy or binding half-life across different LOV2 concentrations. DAG levels are more correlated with binding half-life (E) than they are with CAR occupancy (D). This is reflected in the fact that the DAG response curves nearly overlap with each other when plotted as a function of binding half-life, indicating changing the concentration of LOV2 has little effect on downstream signaling. These data are consistent with binding half-life, not receptor occupancy, dominating CAR signaling. The mean is plotted with a 95% CI (two-sided Student’s t-test).


