. 2019 Apr 5;8:e42498. doi: 10.7554/eLife.42498

Figure 4. A kinetic proofreading model best explains T cell signaling.

(A) Models for how CAR occupancy and binding half-life affect T cell signaling in the presence of moderate (left) or no kinetic proofreading (middle). To facilitate visualization, single cell measurements were fit with non-parametric kernel smoothing regression and plotted as a heat map (right). The degree of proofreading is denoted by n, and the value of n for the moderate proofreading scenario is derived from single cell measurements from all three data sets. (Figure 4—figure supplement 1). Experimental data of DAG levels as a function of CAR occupancy and binding half-life (right) is consistent with moderate kinetic proofreading. (B) Schematic of our kinetic proofreading model. After a ligand binds the receptor, it must remain bound sufficiently long to accommodate the slow proofreading steps. Long lived ligands survive this slow waiting period and produce strong downstream signaling, while short lived ligands dissociate and produce weak downstream signaling.
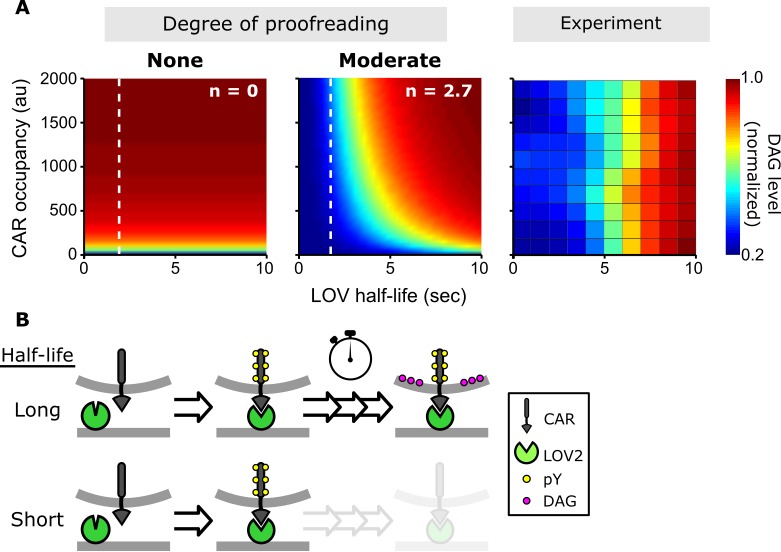
Figure 4—source data 1. This spreadsheet contains all the single cell data used in this study.
It includes measurements of receptor occupancy, ligand binding half-life and cell signaling (either DAG levels or ZAP70 recruitment).
elife-42498-fig4-data1.xlsx (262.1KB, xlsx)
DOI: 10.7554/eLife.42498.025

Figure 4.

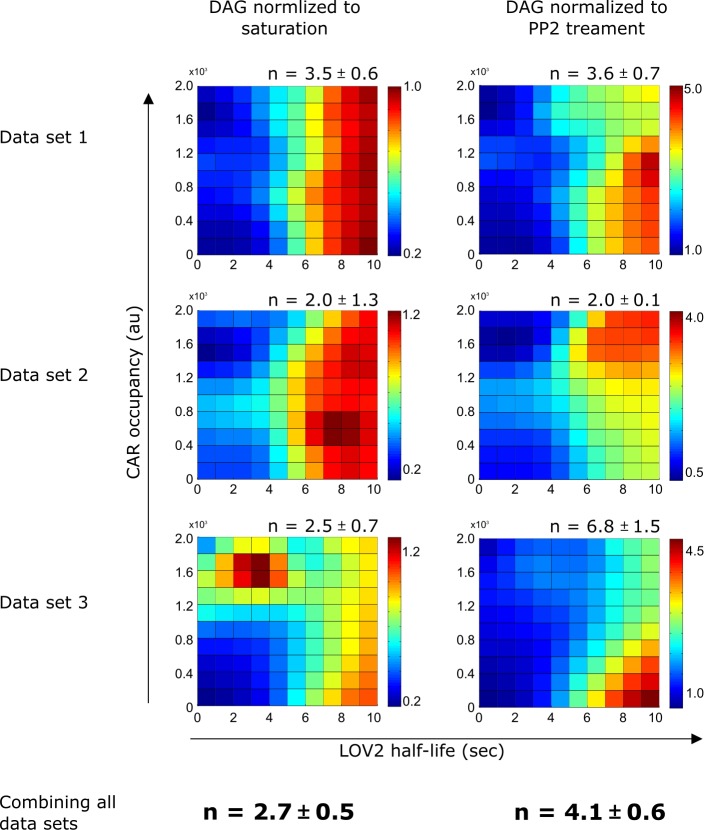
Figure 4—figure supplement 1. DAG normalization method only has a minor effect on the calculated degree of proofreading.

Figure 4—figure supplement 1.

Regardless of normalization method, DAG levels are strongly influenced by LOV binding half-life and produce similar degrees of proofreading (n). Heat maps of DAG signaling were generated by fitting single cell DAG measurements with non-parametric kernel smoothing regression for all three data sets under both DAG normalization schemes. See Figure 4—figure supplement 2 for an explanation of the normalization schemes. n is the degree of proofreading calculated by fitting the single cell DAG measurements to our kinetic proofreading model (Supplemental Equation 7), reported with a 95% confidence interval. We favored normalizing to saturation, as it provided a more conservative estimate of n. Each data set is a biological replicate.
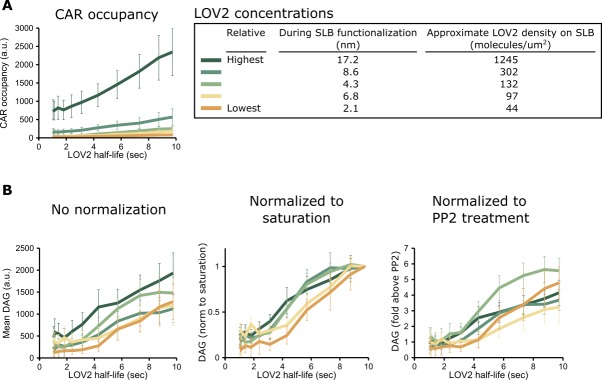
Figure 4—figure supplement 2. Justification for DAG normalization.

Figure 4—figure supplement 2.

(A) Different concentrations of the LOV2 ligand on the SLB drive very different CAR occupancies, as expected. CAR occupancy was mostly linear in response to changing half-lives, suggesting that we operated far from saturation and that neither free CAR nor unbound LOV2 were limiting. (B) By contrast, DAG levels were largely unaffected by large changes in LOV2 concentration, even without normalization (left). Because variation in the DAG reporter expression level affects the raw DAG values, we normalized the data in one of two ways. We either normalized the DAG response relative to a cell’s saturation point (middle) or relative to the background fluorescence from reporter in the cytosol after treatment with PP2, a Src family kinase inhibitor (right). Higher reporter expression produces a higher TIRF signal in this non-signaling state.
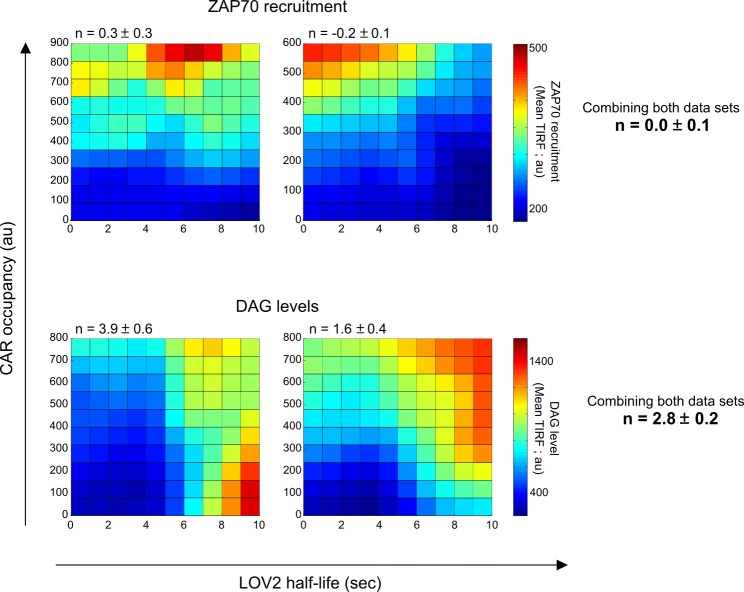
Figure 4—figure supplement 3. ZAP70 recruitment does not show evidence of kinetic proofreading.

Figure 4—figure supplement 3.

Unlike DAG levels, ZAP70 recruitment is dominated by CAR occupancy and is relatively unaffected by the LOV2 binding half-life. Because the ZAP70 reporter is not compatible with the anti-β2 microglobulin antibody, corresponding data sets of the DAG reporter without the antibody were also acquired (bottom row; see Materials and methods for a full explanation). Heat maps were generated by fitting single-cell measurements using non-parametric kernel smoothing regression. Each heat map represents an independent data set. n is the degree of proofreading calculated by fitting the single cell measurements to our kinetic proofreading model (Supplemental Equation 7, substituting DAG levels for ZAP70 recruitment where appropriate), reported with a 95% confidence interval. Each heat map represents a biological replicate.