Figure 5. The opto-ligand-TCR can be switched ON and OFF.
(A) GFP-PIFS-TCR cells were labeled with Indo-1 and calcium influx measured by flow cytometry. The arrow marks the addition of the stimuli indicated, and the grey rectangle the absence of any light. Results show one experiment of n > 3. (B) Calcium influx into GFP-PIFS-TCR cells stimulated with anti-Vβ3, PhyBt(660), PhyBt(740) or PBS was measured as in (A). Results show one experiment of n > 3. (C) GFP-PIFS-TCR Jurkat cells were incubated with PhyBt bound to sepharose beads after a 30 s 660 nm or 740 nm light pulse for 6 hr. Expression of CD69 was quantified by flow cytometry using an APC-labeled anti-CD69 antibody. Data points depict two experiments. (D) Calcium influx was measured as in (A). PhyBt(660) induced calcium influx (blue and orange lines). After 2 min a 1 s short pulse of 100% intensity 740 nm light (red break in the grey bar) terminated the calcium response (blue line). Addition of PhyBt(740) did not induce calcium influx (red line). Results show one experiment of n > 3.

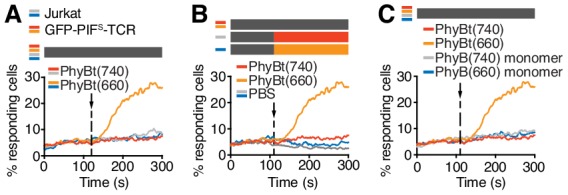
Figure 5—figure supplement 1. Characterization of the optogenetic PhyBt - GFP-PIFS-TCR system.