. 2019 Apr 5;8:e42475. doi: 10.7554/eLife.42475

Figure 6. The half-life of the ON state of PhyB determines TCR signaling.

(A) Schematics of the different PhyB conversions under 660 nm and 740 nm light. In the dark the PhyB states do not change in the timescales relevant for this work. (B) Calcium influx was measured as in Figure 5. GFP-PIFS-TCR cells were constantly illuminated with 100% intensity 660 nm light (orange line). After 150 s PhyBt(660) was added (arrow) and after 390 s the light was switched off. As controls, PhyBt(660) (blue line) or PhyBt(740) (red line) was added to the cells in the dark. The bars represent the illumination procedure during the measurement (grey = dark, orange = 660 nm light). (C) 20 nM PhyBt(660) was added (arrow) after 90 s to GFP-PIFS-TCR cells continuously illuminated with 660 nm light of the depicted intensities. Results in (B) and (C) show one experiment of n > 3. (D) Quantification of experiments done as in (C) with the indicated PhyBt concentrations. Duplicates are shown with connecting lines going through the mean.

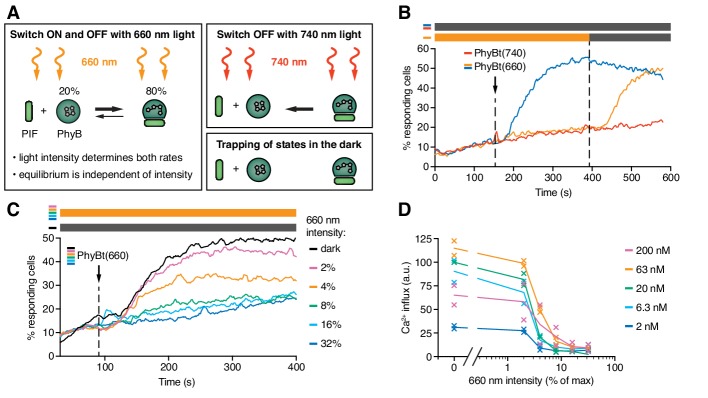
Figure 6—source data 1. Calcium influx quantification data at steady-state.
DOI: 10.7554/eLife.42475.011

Figure 6.

Figure 6—figure supplement 1. Use of the 660 nm light intensity to tune GFP-PIFS-TCR signaling.

Figure 6—figure supplement 1.

(A) A threshold of the 660 nm light intensity to induce a calcium response. The data from Figure 6D were normalized for each PhyBt concentration by setting the value of dark (0% intensity) to 1.0 and value of 32% intensity to 0 to better visualize the overlap of the different curves. Duplicates are shown with connecting lines going through the mean. (B) Calcium influx was measured as in Figure 5. After 85 s of measurement 20 nM PhyBt(660) was added (arrow) to GFP-PIFS-TCR cells in the dark. After 205 s cells were illuminated with 660 nm light of the depicted intensities, or with 740 nm light (red line). As a control, cells were kept in the dark (black line). The result shows one representative experiment of n = 3. (C) Quantification of experiments done as in (B) using normalization as in (A). Shown are the mean of 3 independent experiments ± SEM.