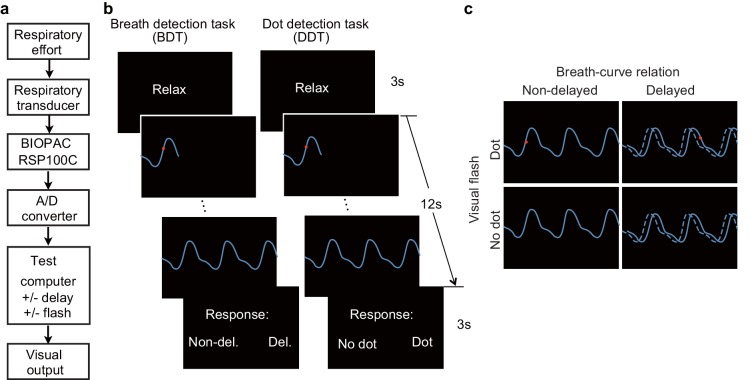
Figure 1. Experimental setup, trial structure of the tasks, and stimulus conditions.
(a) The respiratory effort is converted into electronic signal changes using a respiratory transducer, amplified by BIOPAC, digitized using an A/D converter, and sent to the test computer for the final visual display as a dynamic breath curve, with or without a 400 ms delay. (b) This panel shows two trials for the breath detection task (BDT) and flash dot detection task (DDT) runs, respectively. Each trial begins with a 3 s blank display, followed by a 12 s display of respiratory curve presented with or without a 400 ms delay and with or without a 30 ms red dot flashed at a random position on the curve, and ends with a 3 s response window during which participants make a forced-choice button-press response to two alternative choices depending on the block type (BDT or DDT) to indicate whether the feedback curve is synchronous or delayed (for the BDT run) or whether a dot has appeared (for the DDT run). (c) The task represents a 2 × 2 × 2 factorial design with the factors of attention to breath or dot (block design), presence or absence of breath curve delay, and presence or absence of a dot flashed. The dashed line represents the actual breath curve, while the solid line represents the feedback breath curve displayed on the screen.


