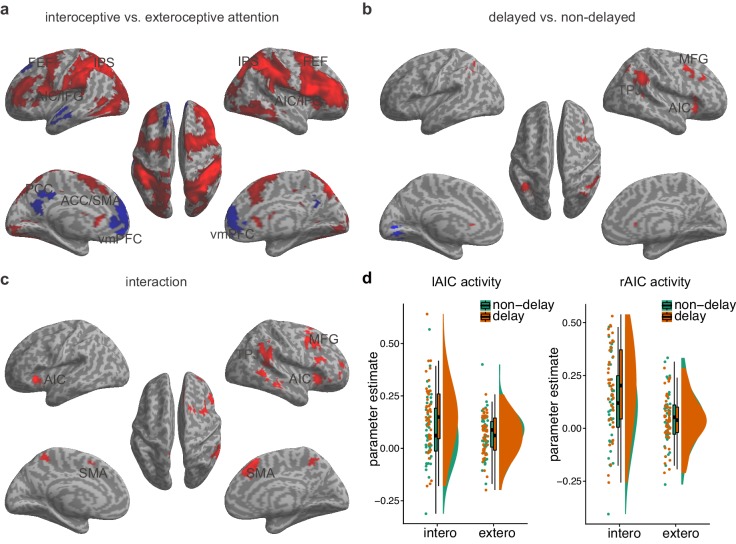
Figure 2. Main effects and the interaction effect of the whole brain analysis of the first sample.
(a) Main effect of interoceptive vs. exteroceptive attention contrast (BDT vs. DDT). (b) Main effect of breath curve feedback condition (delayed curve vs. non-delayed curve). (c) Interaction between attention type and breath-curve feedback condition ([delayed – non-delayed] BDT – [delayed – non-delayed] DDT). Here we showed the left AIC for the visualization of the seed for the ROI analysis in the second fMRI sample, although the cluster with 210 voxels did not survive GRF correction. Red color represents an increased activation; Blue color represents a decreased activation. (d) Activation of the left and the right AIC under the four task conditions, and the pattern of the interaction.

