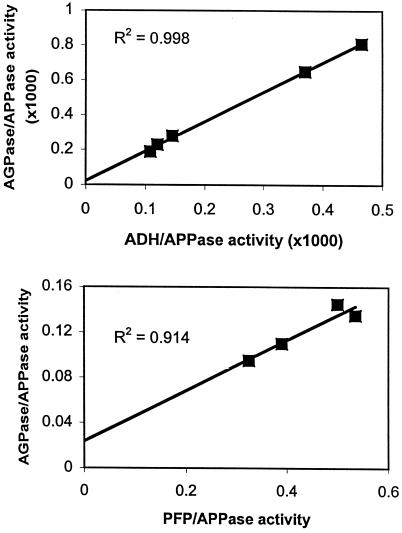
Figure 1.
Subcellular distribution of AGPase activity in barley endosperm determined by the ratio method. Five samples of amyloplast-enriched pellet, each contaminated to a different extent with cytosol, were obtained from a single homogenate of endosperm of H. murinum or H. spontaneum as follows. A sample of the homogenate was taken for assays as described below, then the remainder was divided into four or five samples, each of which was centrifuged identically to produce pellets and supernatant fractions. The supernatant fractions were pooled together. The pellets were resuspended in 1 mL of material that consisted entirely of the supernatant fraction, or of a mixture of the supernatant fraction and AIM, or entirely of AIM. After rupture of the plastids and centrifugation, each of these four or five samples was assayed for a cytosolic marker enzyme, ADH or PFP, for the plastidial marker enzyme alkaline pyrophosphatase (APPase), and for AGPase. The distribution of AGPase activity was determined from the slopes of the plots of (AGPase activity)/(plastid marker enzyme activity) versus (cytosolic marker enzyme activity)/(plastid marker enzyme activity) for these samples (as shown), according to the following assumption: Total AGPase activity = C1 + C2(CMA/PMA), where C1 = pAGPase/PMA and C2 = cAGPase/CMA. PMA, Plastid marker enzyme activity in the unfractionated homogenate; CMA, cytosolic marker enzyme activity in the unfractionated homogenate; pAGPase, plastidial AGPase activity; cAGPase, cytosolic AGPase activity. Top graph, H. spontaneum. Bottom graph, H. murinum. Data from the graphs were as follows: H. spontaneum, y = 1.73x + 0.143 (hence, C1 = 0.143 and C2 = 1.73), CMA/PMA = 0.097; and H. murinum, y = 0.220x + 0.025 (hence, C1 = 0.025 and C2 = 0.220), CMA/PMA = 0.560.

