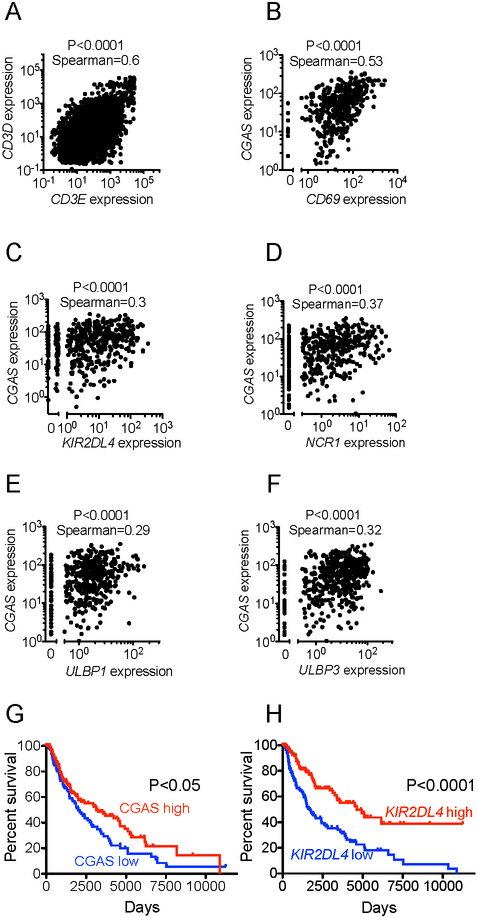
Figure 7. Clinical correlations with cGAS and NK cells in human melanoma.
All the data were obtained from The Cancer Genome Atlas (TCGA). (A) Plot of expression of CD3E vs. expression of CD3D across all cancers. (B) Plot of expression of cGAS vs. expression of CD69 in melanoma. (C) Plot of expression of cGAS vs. expression of KIR2DL4 in melanoma. (D) Plot of expression of cGAS vs. expression of NCR1 in melanoma. (E) Plot of expression of cGAS vs. expression of ULBP1 in melanoma. (F) Plot of expression of cGAS vs. expression of ULBP3 in melanoma. (G) Kaplan-Meier plot of melanoma patient survival; patients are segmented by cGAS expression (highest and lowest thirds). (H) Kaplan-Meier plot of melanoma patient survival; patients are segmented by KIR2DL4 expression (highest and lowest thirds). For correlations of expression, statistical significance was assessed using the Spearman coefficient. For survival analysis, statistical significance was assessed using the log-rank test.

