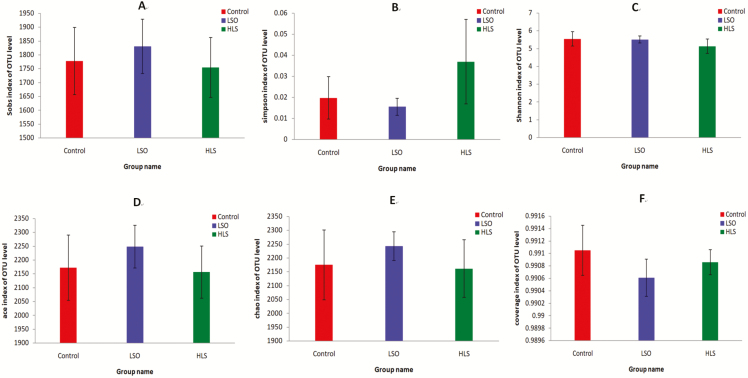
Figure 2.
Student’s t-test for α diversity indices of ruminal bacteria in kids fed the linseed oil (LSO), heated linseed grain (HLS) and Control diets. (A) Observed species; (B) Simpson index; (C) Shannon index; (D) ACE index; (E) Chao index; (F) Good’s coverage index. For each value, n = 5. Error bars show standard deviation. Each color represents one treatment: The red represents kids fed Control diet; the blue represents kids fed LSO diet and the green represents kids fed HLS diet.

