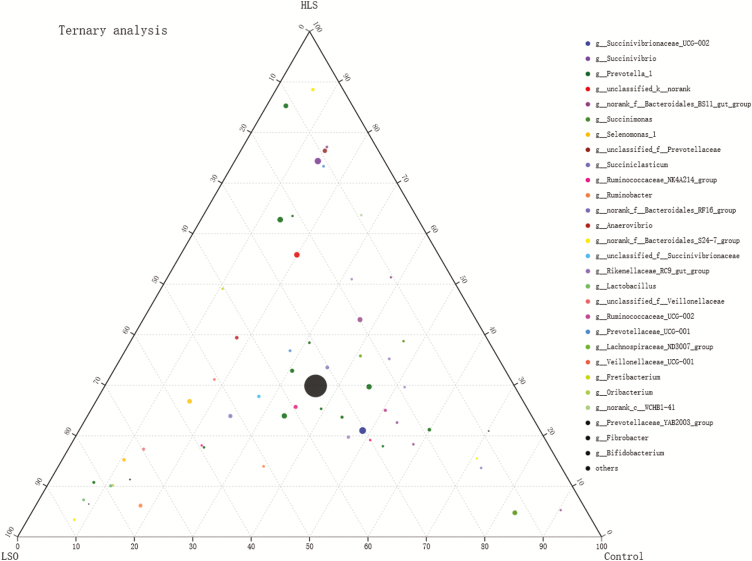
Figure 4.
Ternary plot of operational taxonomic units (OTUs) showing the percent of observations for each OTU (>0.5%) present in each dietary group (linseed oil, LSO, heated linseed grain, HLS, Control). The taxonomic list at genus level corresponds to OTU of points. For example, a point positioned within the “70” triangle at the ‘LSO’ corner of the ternary plot indicates that 70% of all observations of that OTU occur within the LSO group. Diameter of plotted points corresponds to relative abundance of the OTU. Compartments of the dotted grid correspond to 10% increments.

