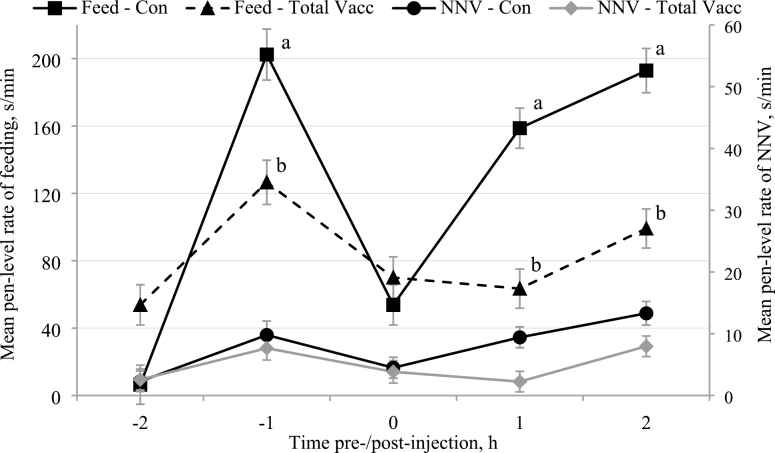
Figure 2.
The mean (±SEM) pen level hourly rates of feeding (feed) and non-nutritive visits (NNV) before and after injections (time of day of injections: 0 h) during the saline control days (Con) and the days of total vaccination of all pigs within the pens (total Vacc). Effect of treatment – feeding: P < 0.001, NNV: P < 0.010; time of day – feeding: P < 0.001, NNV: P < 0.001; and treatment × time of day – feeding: P < 0.001; NNV: P = 0.150. Differences of P < 0.05 in the least square mean feeding rates between the Con and total Vacc treatments at the same time points are marked with different superscripts.

