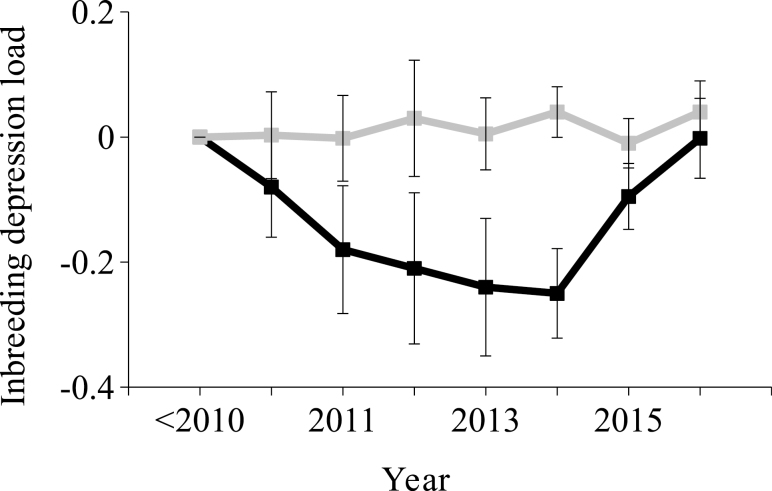
Figure 5.
Genetic trend for inbreeding depression load in Entrepelado (black) and Retinto varieties (gray). Squares show the average load of boars and sows born each year, and error bars show the 95% credibility interval. Individuals born before 2010 were grouped in the same category and used as reference (average inbreeding depression load, 0).

