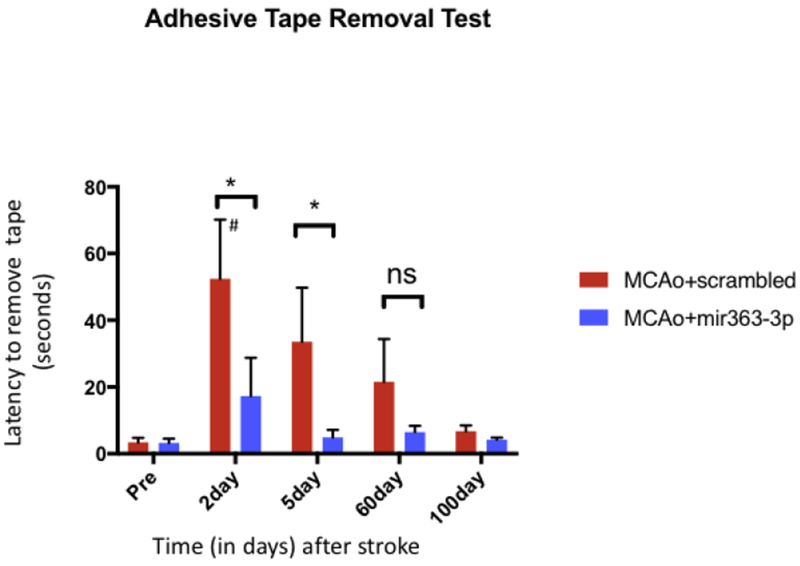
Fig 2:

Assessment of stroke-associated sensorimotor impairment: Histogram depicts mean±SEM of the latency (in seconds) to remove an adhesive tape from the forepaw of the limb contralateral to the ischemic hemisphere. This test was performed before (Pre) and at 2, 5, 60 and 100d after stroke. Key: #: p<0.05, comparison of the group with its baseline levels; *: p<0.05, comparison of treated vs control groups at the same time point. ns: not significant.
