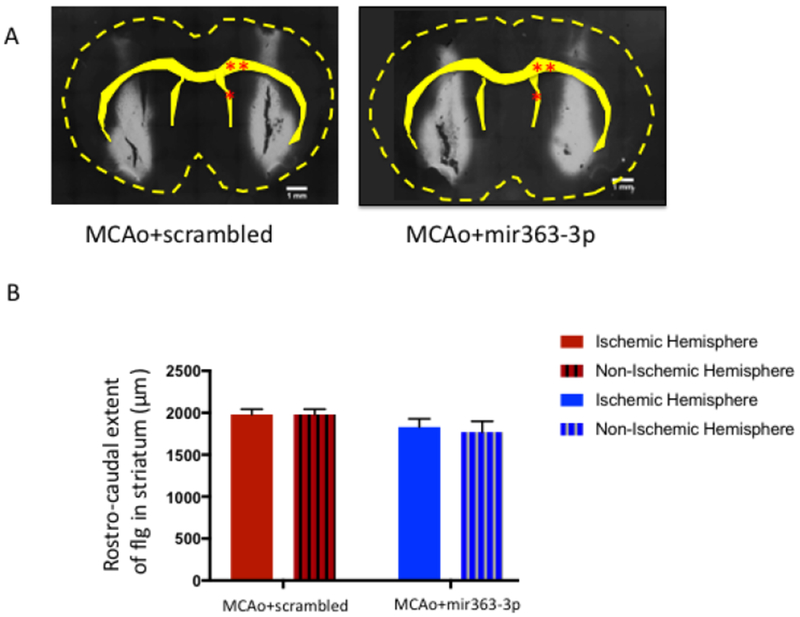
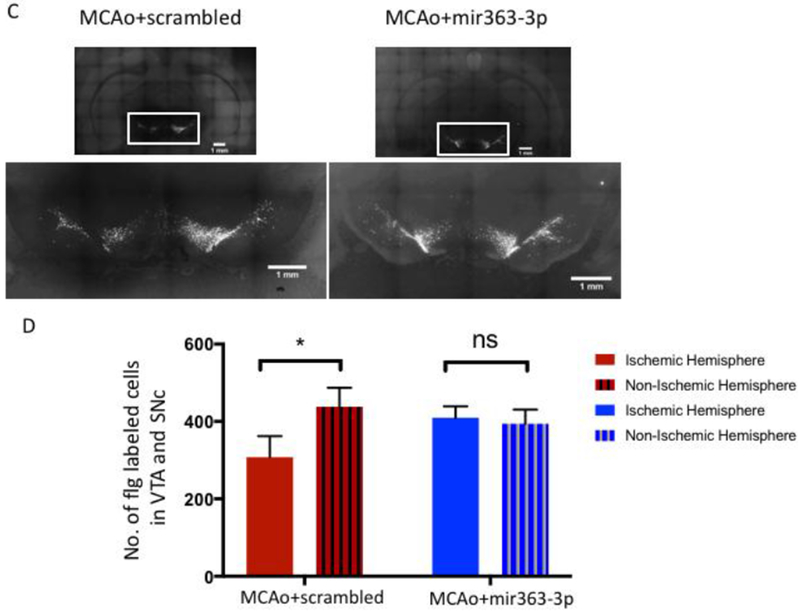
Fig 8:


Assessment of the mesostriatal pathway at 3+ months (107d) after stroke: A) Photomicrograph depicting bilateral injections of Fluorogold into the striatum. The outline of the brain and key landmarks are shown in stippled yellow. B) The rostrocaudal extent of Fluorogold dye was similar in both hemispheres and in both groups, indicating similar amount of dye at the target site. C) Fluorogold labeling of SNc and VTA neurons: Photomicrograph of a coronal section depicting Flg-labeled neurons in the VTA and SNC from the MCAo+scrambled group (Ci) and MCAo+mir363-3p treated group (Cii). Boxed area in each image is shown in higher magnification below. D) Histogram depicts mean (±SEM) number of Flg-labeled cells in SNc and VTA in the ischemic and non-ischemic hemisphere. *: p<0.05, ns: not significant. Single red asterisk: Lateral ventricle, double red asterisk: Corpus callosum
