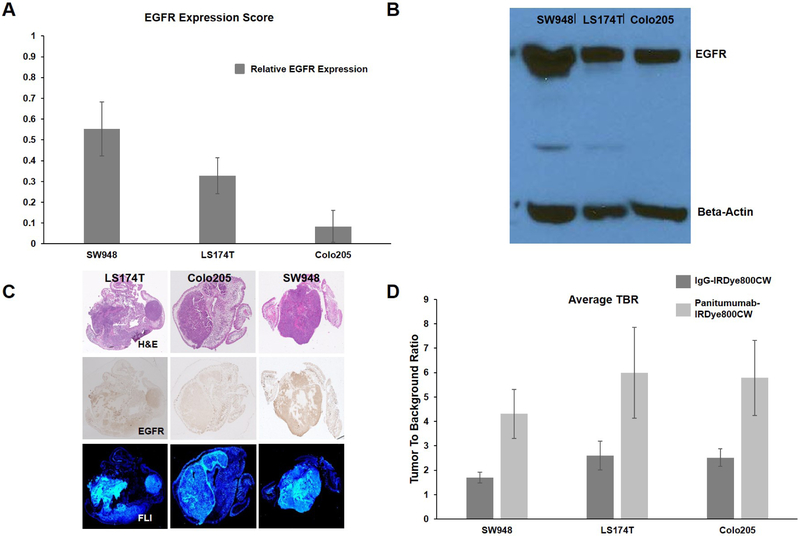
Figure 4-. Evaluation of EGFR expression and overall TBR:
(A) Results of semi-quantitative EGFR expression rating; EGFR expression score refers to the percentage each cell line was selected as having darker EGFR staining when compared against another cell line (n = 90 individual comparisons). (B) Western blot for EGFR with beta-actin control. (C) Representative tumor sections from each cell line with H&E staining, IHC for EGFR, and microscopic FLI. (D) Overall TBR for each cell line averaging TBR values from days one through ten.

