Figure 1.

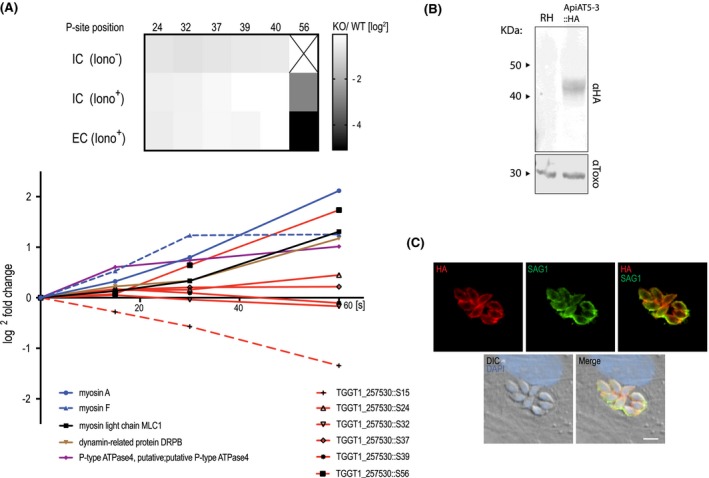
ApiAT5‐3 localises to the plasma membrane and is phosphorylated at serine 56 upon ionophore treatment. A. Quantification of the phosphorylation state of residues in the ApiAT5‐3 N‐terminus in TgCDPK3 KOs and during ionophore‐induced egress (from Treeck et al., 2014). Upper panel: The heatmap shows differential phosphorylation of S56 in TgCDPK3 mutants compared to WT parasites, but not any other of the identified phosphorylation sites. Intracellular (IC) and extracellular (EC) parasites with and without 1 µM ionophore (iono). P‐site = phosphorylation site. Numbers represent residue position. Black ‘x’ = phosphorylation site not identified. Fold changes are log2. Bottom panel: Change in relative phosphorylation of ApiAT5‐3 and proteins with previously described ionophore‐dependent phosphorylation sites, measured after addition of 8 µM ionophore over 60 s. Numbers after the identifier represent the phosphorylation site quantified. B. ApiAT5‐3 was detected by Western blot analysis of ApiAT5‐3::HA cell lysate using an anti‐HA antibody. Loading control anti‐Toxo. C. IFA of ApiAT5‐3::HA expressing parasites shows that ApiAT5‐3 localises to the periphery of the intracellular tachyzoite. Red = HA, Green = SAG1, Blue = DAPI. Scale bar 5 µm.
