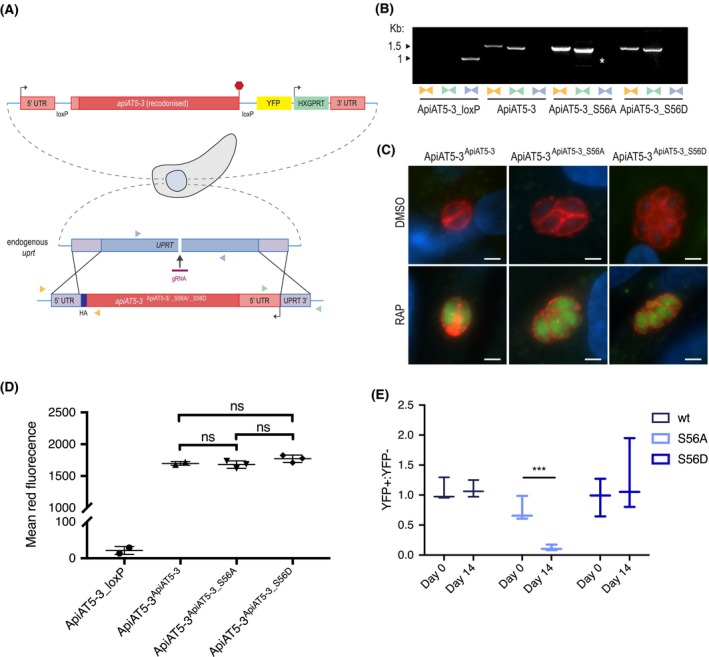
Figure 4.

∆apiAT5‐3 ApiAT5‐3_S56A demonstrates a fitness defect. A. Generation of the ApiAT5‐3ApiAT5‐3/_S56A/_S56D complementation lines. PAM indicated by black arrow. Primer pairs represented by coloured triangles. B. PCR analysis shows correct integration of the ApiAT5‐3_loxP construct at both the 3ʹ and 5ʹ ends and a loss of uprt. White * = nonspecific band. C. IFA of ApiAT5‐3ApiAT5‐3/_S56A/_S56D::HA expressing parasites shows that ApiAT5‐3 is correctly trafficked to the periphery of the intracellular tachyzoite in both the presence (DMSO) and absence (RAP) of the endogenous apiAT5‐3. Red = HA. Green = YFP, indicating correct excision of the endogenous apiAT5‐3. Scale bar 10 µm. D. Geometric mean of red fluorescence calculated by flow cytometric analysis of complemented parasites, probed with red fluorescent anti‐HA antibody. Statistical analysis carried out using multiple comparison, two‐way ANOVA, ns = not significant. All complemented lines differ significantly in mean fluorescence from ApiAT5‐3_loxP (p < 0.0001), n = 3. E. Growth competition assay by flow cytometry shows that ∆apiAT5‐3 ApiAT5‐3_S56A parasite growth is reduced relative to the non‐excised ApiAT5‐3ApiAT5‐3_S56A line. Statistical analysis using multiple comparison, two‐way ANOVA of mean ratio to day 0 normalised to 1. ***p < 0.001, n = 3.
