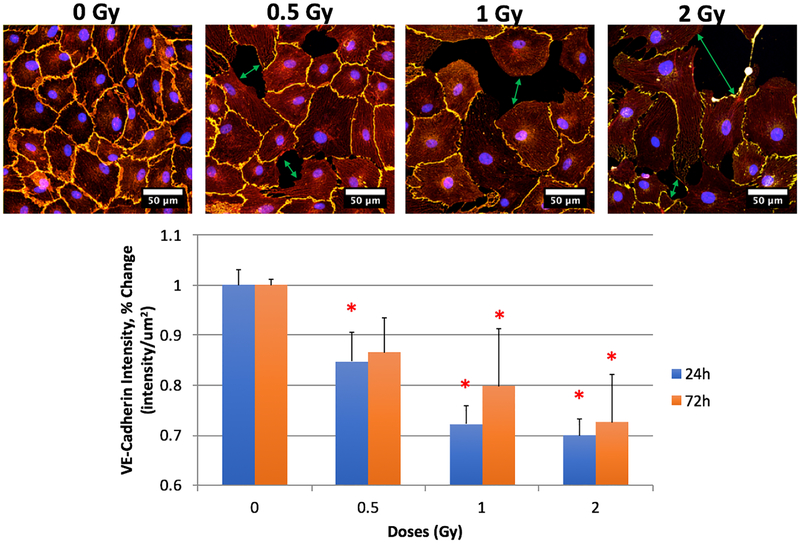
Fig. 1:
LEC expression of VE-cadherin and F-actin. Top row: VE-cadherin (yellow), F-actin (red), DRAQ7 (blue) representative images from 24h 0, 0.5, 1, and 2 Gy. Bottom: Expression changes of VE-Cadherin 24- and 72-hours after X-ray irradiation exposure. N = 3 per time-point + dose, p < 0.05 denoted by *, statistical difference from corresponding time-point 0 Gy control.

