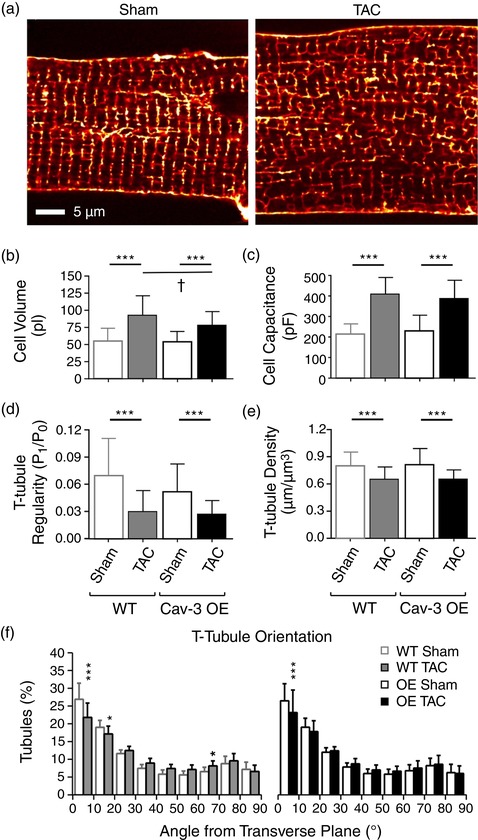
Figure 2.

Morphology of isolated myocytes. (a) Confocal images of t‐tubules and surface sarcolemma stained with di‐8‐ANEPPS from representative sham (left) and TAC (right) Cav‐3 OE myocytes. Scale bar: 5 μm. (b,c) Cell volume (b) and cell capacitance (c) from sham (n/N = 19/5) and TAC (n/N = 22/5) Cav‐3 OE myocytes (right) compared with WT sham (n/N = 41/10) and TAC (n/N = 21/5) myocytes (left). (d–f) Analysis of t‐tubule organization from di‐8‐ANEPPS‐labelled sham (n/N = 23/5) and TAC (n/N = 27/5) Cav‐3 OE myocytes (right) and WT sham (n/N = 40/8) and TAC (n/N = 21/5) myocytes (left). (d) T‐tubule power (P 1/P 0). (e,f) T‐tubule density (μm μm−3; e) and T‐tubule orientation (degrees from transverse plane; f) in WT and Cav‐3 OE myocytes. ***P < 0.001 between treatments for a given phenotype (WT or Cav‐3 OE); †P < 0.05 between phenotypes for a given treatment (sham or TAC). The WT data have been published previously (Bryant et al., 2018a)
