Figure 3.

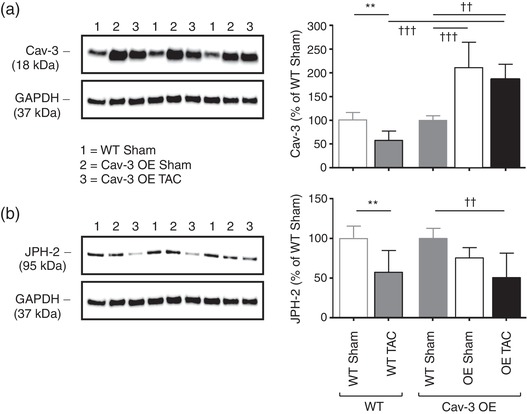
Effect of Cav‐3 OE and TAC on Cav‐3 and JPH‐2 protein expression. (a) Left panel, exemplar western blots of Cav‐3 (18 kDa) and GAPDH (37 kDa) in isolated myocyte lysates from three WT sham (lanes 1), three Cav‐3 OE sham (lanes 2) and three Cav‐3 OE TAC (lanes 3) mice; Right panel, densitometry analysis of Cav‐3 western blots (N = 5 animals in each group in duplicate), compared with previously published data (Bryant et al., 2018a) showing the effect of TAC on Cav‐3 expression in WT mice (left two bars). (b) Left panel, exemplar western blots of JPH‐2 (95 kDa) and GAPDH (37 kDa); right panel, densitometry analysis of JPH‐2 western blots (N = 5 animals in each group in duplicate), compared with previously published data (Bryant et al., 2018a) showing the effect of TAC on JPH‐2 expression in WT mice (left two bars). The blots in the left panels are from the same gels which were stripped and re‐probed for the different proteins and were therefore obtained sequentially (see Methods). Data in each group (WT or Cav‐3 OE) in the right panels are expressed as a percentage of the mean of the WT data in that group. **P < 0.01, between treatments for a given phenotype (WT or Cav‐3 OE); ††P < 0.01, †††P < 0.001 between phenotypes
