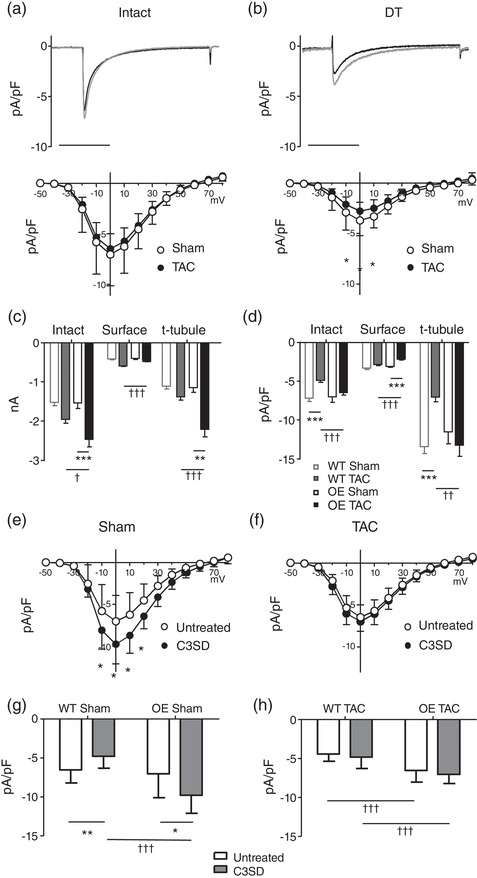
Figure 4.

Surface and t‐tubular I Ca. (a) Top panel, exemplar records of I Ca from intact sham (black) and TAC (grey) Cav‐3 OE myocytes. Bottom panel, corresponding mean I Ca density–voltage relationships from sham (n/N = 19/5) and TAC (n/N = 22/5) Cav‐3 OE myocytes. Two‐way repeated measures ANOVA: mV P < 0.001, TAC P = 0.4, interaction P < 0.9. (b) Top panel, exemplar records of I Ca from detubulated (DT) sham (black) and TAC (grey) Cav‐3 OE myocytes. Bottom panel: corresponding mean I Ca density–voltage relationships from DT sham (n/N = 19/5) and TAC (n/N = 21/5) Cav‐3 OE myocytes. Two‐way repeated measures ANOVA: mV P < 0.001, TAC P < 0.001, interaction P < 0.001. (c,d) Absolute I Ca (c) and I Ca density (d) at 0 mV in intact Cav‐3 OE myocytes, and at the cell surface and t‐tubules (obtained as described in Methods), compared with previously published data (Bryant et al., 2018a) from WT mice. **P < 0.01, ***P < 0.001 between treatments for a given phenotype (WT or Cav‐3 OE); †P < 0.05, ††P < 0.01, †††P < 0.001 between phenotypes for a given treatment (sham or TAC). (e) Mean I Ca density–voltage relationships from sham untreated (n/N = 19/5) and C3SD treated (n/N = 12/3) Cav‐3 OE myocytes. Two‐way repeated measures ANOVA: mV P < 0.001, C3SD P = 0.014, interaction P < 0.001). (f) Mean I Ca density–voltage relationships from TAC untreated (n/N = 22/5) and C3SD treated (n/N = 17/5) Cav‐3 OE myocytes. Two‐way repeated measures ANOVA: mV P < 0.001, C3SD P = 0.13, interaction P = 0.4. (g) Mean I Ca density at 0 mV in sham untreated and C3SD treated Cav‐3 OE myocytes, compared with previously published data (Bryant et al., 2018a; see Methods) from sham untreated (n/N = 16/5) and C3SD treated (n/N = 17/5) WT myocytes. Two‐way ANOVA: OE P < 0.001, C3SD P = 0.4, interaction P < 0.001. (h) Mean I Ca density at 0 mV in TAC untreated and C3SD treated Cav‐3 OE myocytes, compared with previously published data (Bryant et al., 2018a; see Methods) from TAC untreated (n/N = 19/5) and C3SD treated (n/N = 15/5) WT myocytes. Two‐way ANOVA: OE P < 0.001, C3SD P = 0.14, interaction P = 0.84. *P < 0.05, **P < 0.01 between treatments for a given phenotype (WT or Cav‐3 OE); †††P < 0.001 between phenotypes for a given treatment
